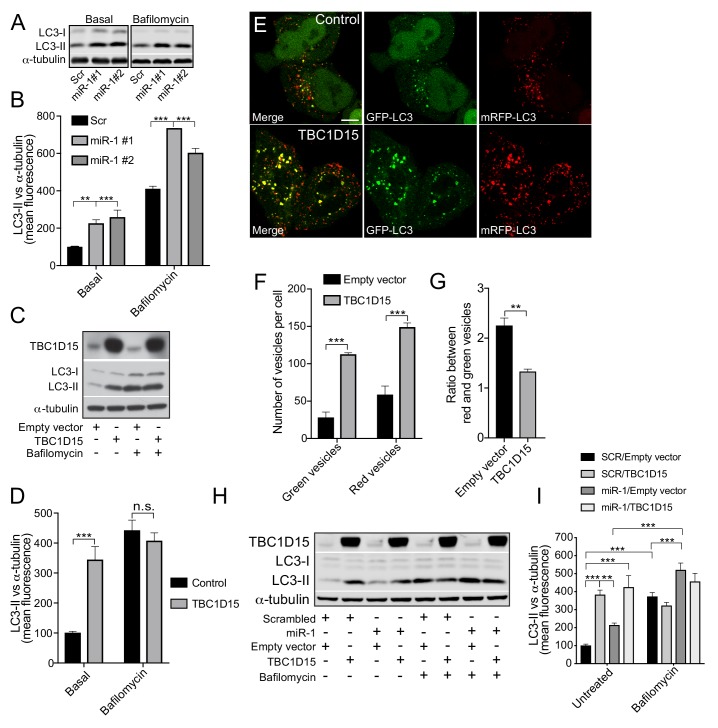
Figure 4. Human miR-1 regulates autophagy by controlling TBC1D15 expression.
(A) WB and (B) quantification of LC3-II normalised to α-tubulin from HeLa cells expressing Scr or miR-1 mimics +/- bafilomycin. Data are mean fluorescence intensities of bands ± SEM (n = 3–5). **p<0.01, ***p<0.001 (one-way ANOVA with Dunnett’s correction). (C) WB and (D) quantification of LC3-II normalised to α-tubulin from HeLa cells expressing empty vector (control) or TBC1D15 overexpression vector +/- bafilomycin. Data are mean fluorescence intensities of bands ± SEM normalised to α-tubulin (n = 5). n.s. not significant to the control, ***p<0.001 (two-way ANOVA with Bonferroni correction). (E) IF images of HeLa cells stably expressing mRFP-GFP-LC3 and transfected with empty vector (control) or TBC1D15 overexpression vector. Scale bar, 10 μm. (F) Quantification of green and red vesicles and (G) red/green vesicle ratio from (E) ± SEM (n = 3, 12–14 cells per replicate). **p<0.01, ***p<0.001 (Student’s t-test). (H) WB and (I) quantification of HeLa cells co-transfected with Scr or miR-1 mimic together with empty vector or TBC1D15 overexpression vector +/- bafilomycin. Data are mean fluorescence intensities of LC3-II bands normalized to α-tubulin ± SEM (n = 7). **p<0.01, ***p<0.001 (two-way ANOVA with Bonferroni correction).
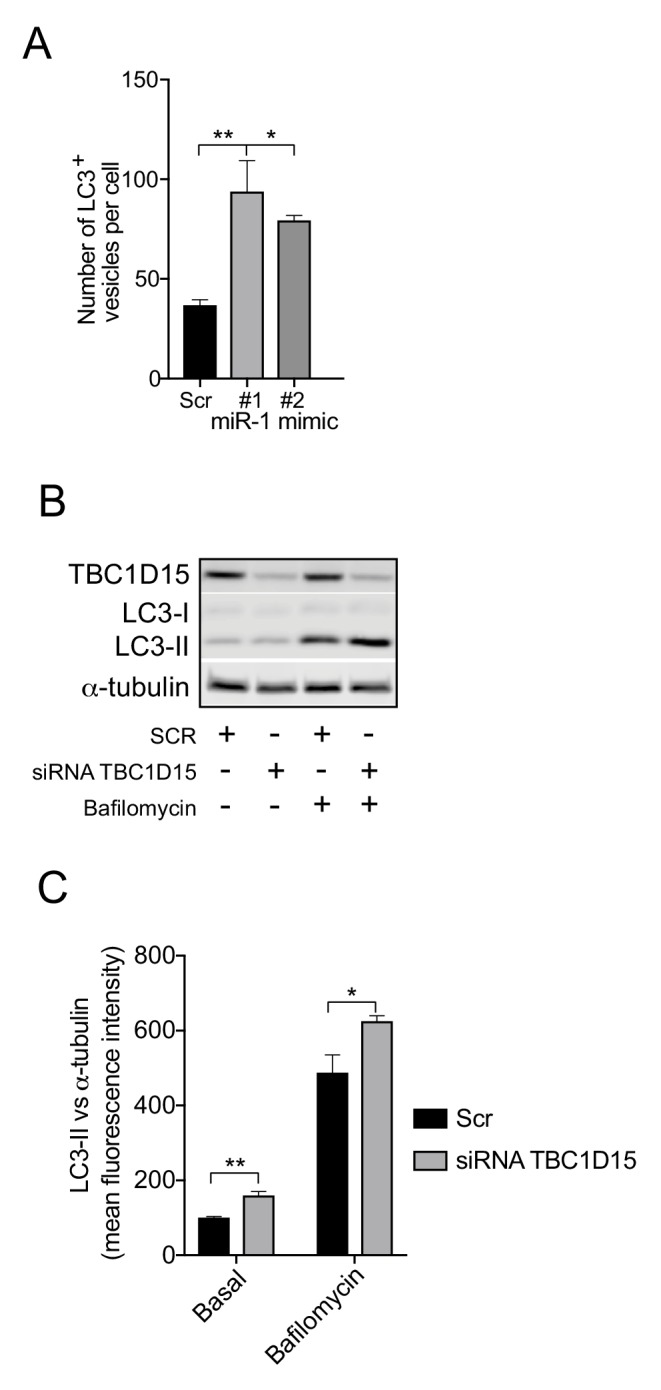
Figure 4—figure supplement 1. miR-1 and TBC1D15 control autophagy.

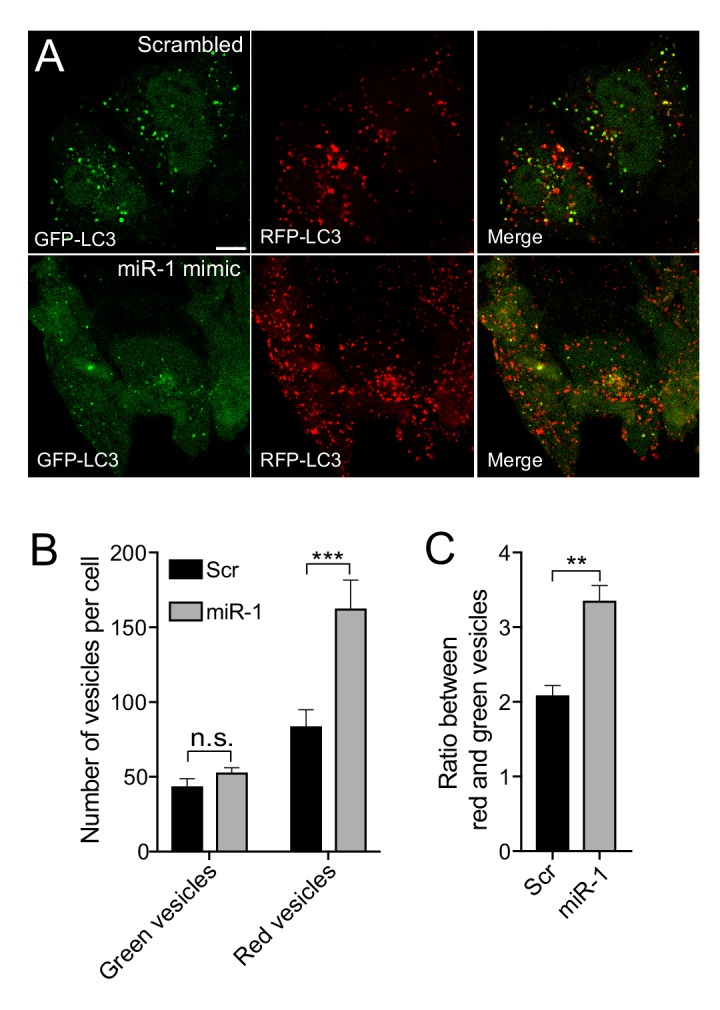
Figure 4—figure supplement 2. miR-1 overexpression induces autophagy flux.


