Figure 2.
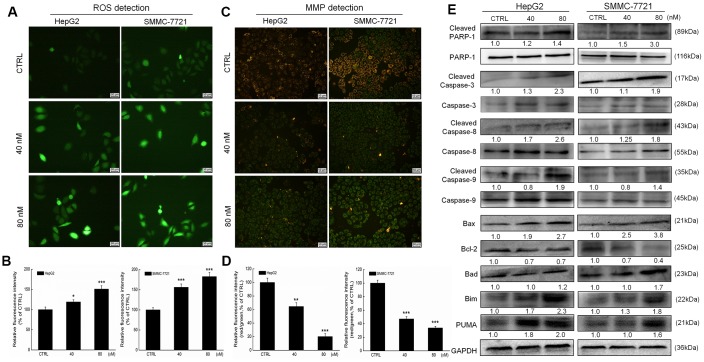
Erianin induced mitochondrial apoptosis in liver cancer cells. Erianin (A) increased intracellular reactive oxygen species (ROS) production and (C) decreased the mitochondrial membrane potential (20× magnification, scale bar: 50 μm). Qualitative data are expressed as (B) the green fluorescence intensity and (D) the ratio of red to green fluorescence intensity. Data are expressed as percentages relative to the corresponding control cells and mean ± SD (n = 6). *P < 0.05, **P < 0.01 and ***P < 0.001 vs control cells. (E) Erianin significantly enhanced the ratio of cleaved PARP/PARP, cleaved caspase-3/caspase-3, cleaved caspase-8/caspase-8 and cleaved caspase-9/ caspase-9, and the expression levels of Bax, Bad, Bim and PUMA, and reduced the expression levels of Bcl-2 in HepG2 and SMMC-7721 cells. Quantitative protein expression data were normalized to GAPDH expression levels in the corresponding samples. The marked average changes of proteins were expressed as folds relative to the corresponding control cells (n = 6).

