Figure 4.
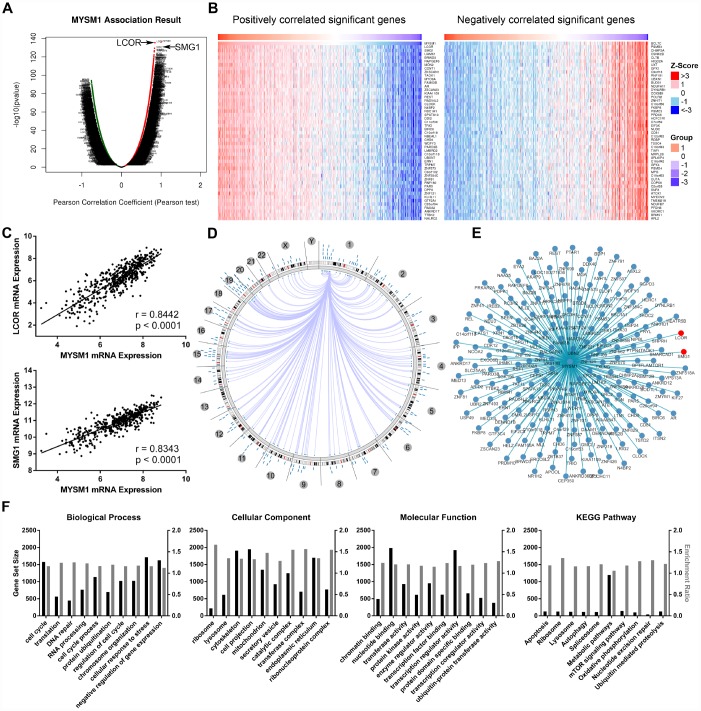
Integrative multiomics analysis of MYSM1 mRNA expression in prostate cancers. (A) Association of MYSM1 with genes differentially expressed in prostate cancers. (B) Heatmaps for genes positively (left) and negatively (right) correlated with MYSM1 in prostate cancers (top 50). (C) Correlation of MYSM1 with LCOR (upper) and SMG1 (lower) mRNA levels in prostate cancers. Pearson correlation coefficients and significance levels are indicated. Data (A–C) were collected from TCGA database and analyzed via LinkedOmics bioinformatics. (D) Statistically significant associations of MYSM1 with genomic coordinates are indicated by arcs connecting pairs of dots in prostate cancers. (E) Network view of correlations between MYSM1 and other genes in prostate cancers. Data (D–E) were acquired from TCGA database and analyzed via Regulome Explorer. (F) Significantly enriched GO annotations and KEGG pathways of genes correlated with MYSM1 in prostate cancers. Data were acquired from TCGA database and analyzed via GSEA bioinformatics.

