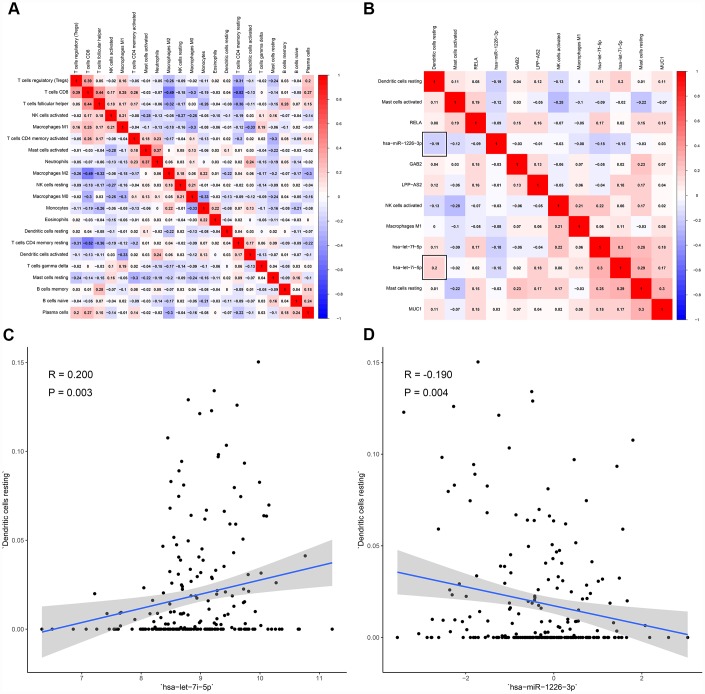
Figure 7.
The co-expression patterns among fractions of immune cells and key members in the ceRNA network. (A) co-expression heatmap of all immune cells; (B) co-expression heatmap of prognostic immune cells and key members of ceRNA network; (C) has-let-7i-5p was significantly associated with dendritic cells resting (R = 0.200, P = 0.003); (D) hsa-miR-1226-3p was significantly associated with dendritic cells resting (R = -0.190, P = 0.004).

