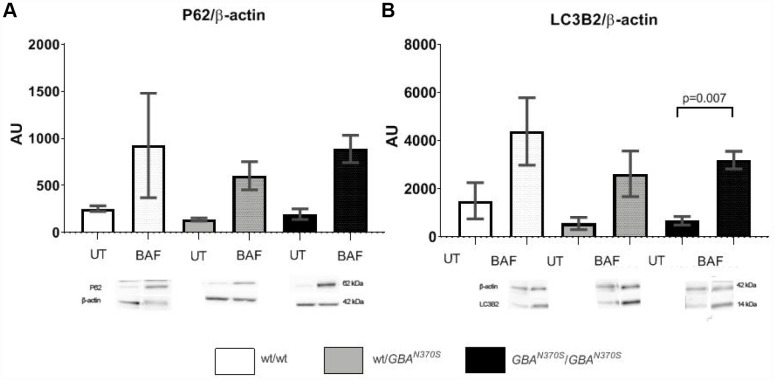
Figure 6.
Autophagy flux measurement. Macroautophagy flux showed trends to further increase in the control lines. p62 and LC3-2 levels are similar in the 3 untreated cell lines, however, when autophagy was blocked under bafilomycin treatment, p62 and LC3-2 levels tended to increase the most in controls. The lack of significant differences suggests that preexistent mitochondrial impairment may account for the pathogenesis of GBA mutant neurospheres. AU, arbitrary units; UT, untreated; BAF, bafilomycin. Results are expressed by mean± SEM.

