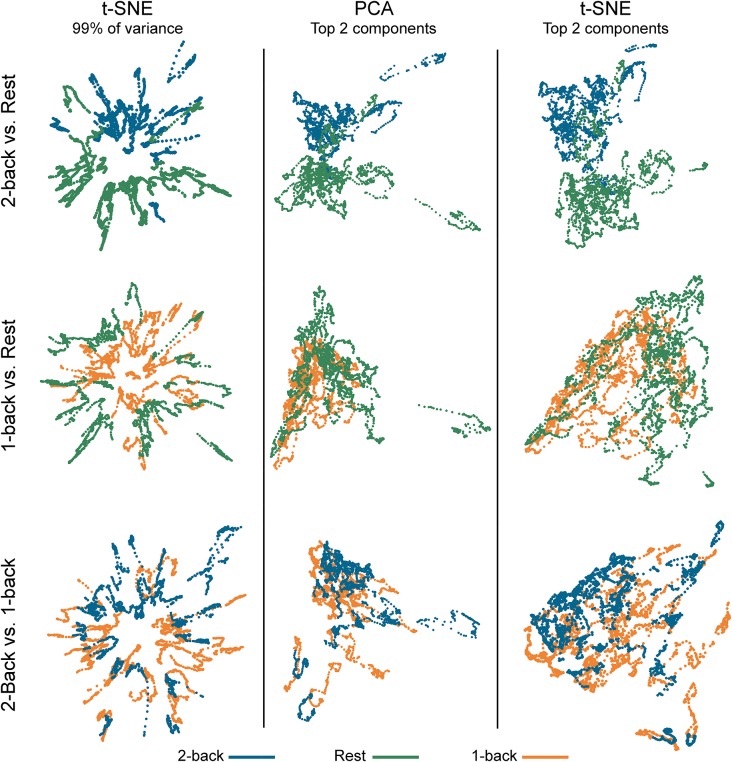
Figure 2.
Embedded dynamic brain networks across tasks. Embedded networks are shown for younger adults to contrast 2-back working memory task and rest (top row), 1-back working memory task and rest (middle row), and 2-back and 1-back working memory tasks (bottom row). Each column shows a different 2D embedding method. Although patterns differ between embedding methods, the same trend is apparent across methods: 2-back and rest have the greatest separation, 1-back and rest are less distinct, and 2-back and 1-back have the least separation. The embedded networks are colored by task: 2-back—blue, rest—green, 1-back orange. For both t-distributed stochastic neighbor embedding (t-SNE) datasets, the embedding was repeated 50 times, but only one representative map is shown here.

