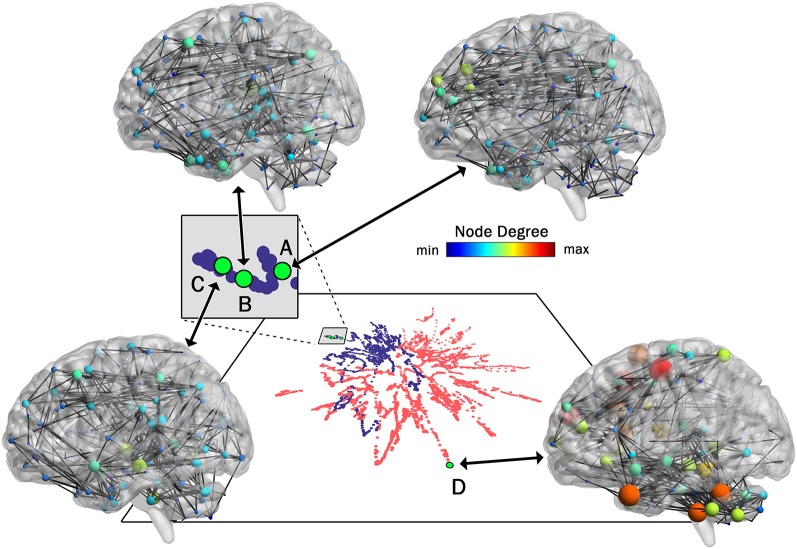
Figure 4.
One-to-One mapping of low and high dimensional data. High dimensional networks associated with four sample low dimensional 2D points in the t-SNE embedding (created with 99% of variance) are shown here. Three networks associated with a younger individual (A, B, and C) and one network associated with an older individual (D) are shown. Interestingly, although in the series of dynamic brain networks, network B (85th network) is closer to network A (72th network) in time when compared to network C (117th network), the connectivity of network B is more similar to network C when compared to network A, resulting in closer locations in 2D space. Also, as shown in this figure, all three networks associated with the younger individual are substantially different from the network associated with the older individual. This is clearly captured by the large separating in the low-dimensional space. For visualization purposes, all four networks were thresholded to maintain the strongest 1.5% of connections. Network images were generated using the actual Pearson’s correlation matrices in BrainNet viewer software (Xia et al., 2013).

