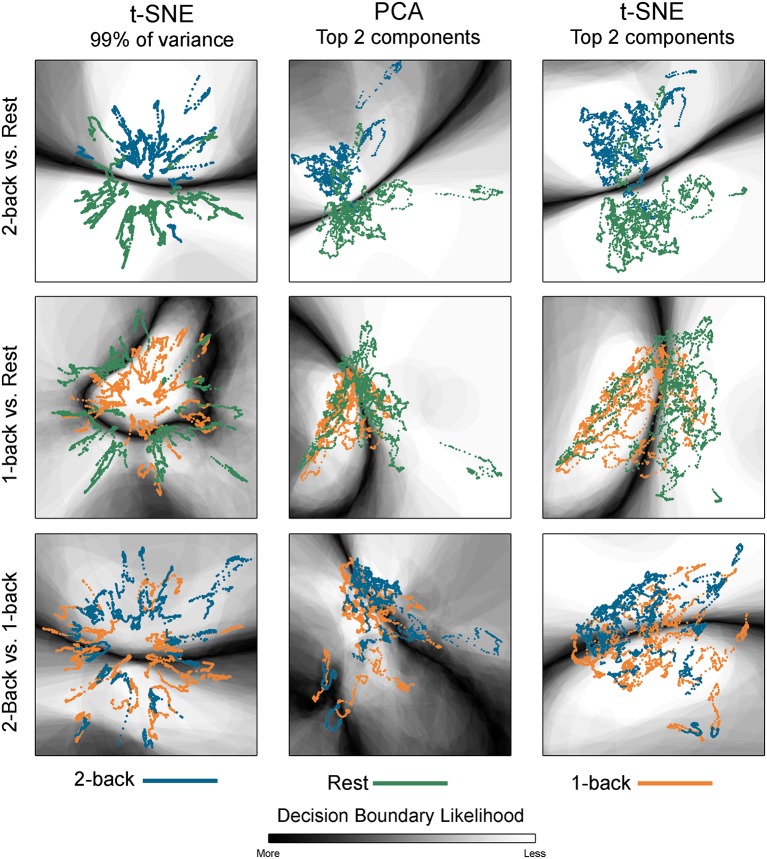
Figure 5.
Classification boundaries for embedded task-based networks. Boundaries for younger adults comparing 2-back working memory task and rest (top row), 1-back working memory and rest (middle row), and 2-back and 1-back working memory tasks (bottom row). The dynamic networks are overlaid on the classification boundaries for visualization purposes. Each column shows a different 2D embedding method. The decision boundaries generated from 100 permutations of classifier training/testing were averaged to produce these maps. The darker the background shading the more likely a boundary was present in that location across the 100 permutations. Dark-light interfaces separate networks from different conditions. The probability of being consistently classified across permutations is higher for networks located in the lighter regions. For the 2-back/rest comparisons the boundary makes a fairly clear separation between networks from the two conditions for all embedding methods. For the 1-back/rest comparison, the conditions are not as well separated and the boundaries are less distinct. For the 2-back/1-back comparisons the boundaries are much less distinct and are widely spread across the space. The classification accuracy closely parallels the distinctness of the boundaries. For both t-SNE datasets, only one representative map of the decision boundary (from the 50) is shown here.

