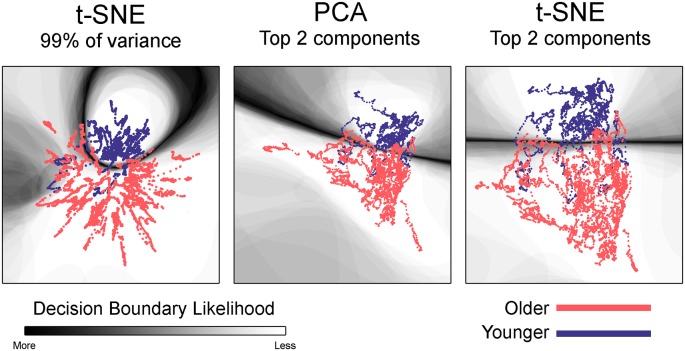
Figure 6.
Classification boundaries for embedded group-based networks. Boundaries for classifying younger vs. older adults during the 1-back working memory task. Embedding methods are labeled above each mapping. For all embedding methods, the boundary is fairly distinct and clearly separates the study groups. The dynamic networks are overlaid on the classification boundaries for visualization purposes. See Figure 5 for more details concerning figure interpretation. For both t-SNE datasets, only one representative map of the decision boundary (from the 50) is shown here.

