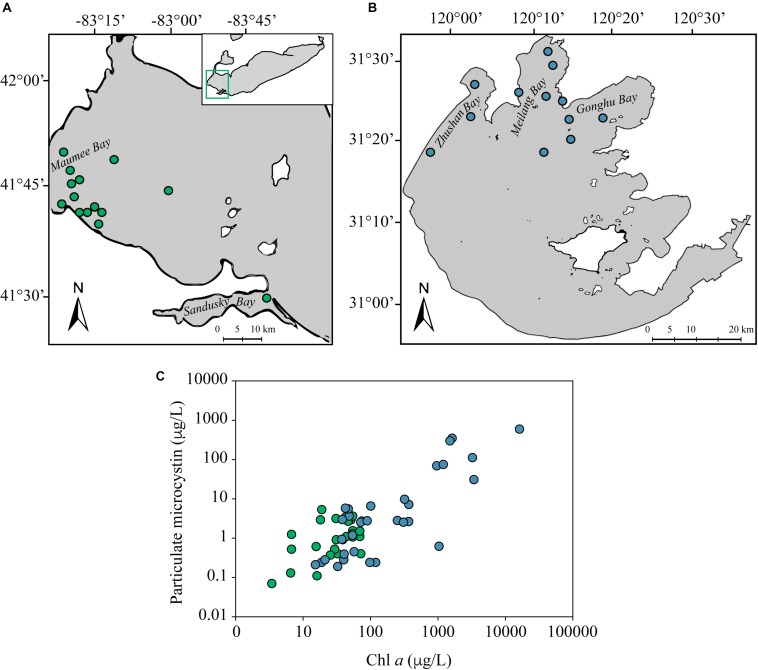
FIGURE 1.
Map of Lake Erie (A) and Taihu (B). Stations sampled for metatranscriptomes are depicted as green (Lake Erie) or blue (Taihu) circles. Coordinates for each sample location can be found in Supplementary Tables S3, S4. Particulate microcystin and chl a dynamics depict the range of bloom severity and toxicity amongst samples used in the metatranscriptomic analysis (C). The particulate microcystin and chl a concentrations for each sample can be found in Supplementary Tables S3, S4.

