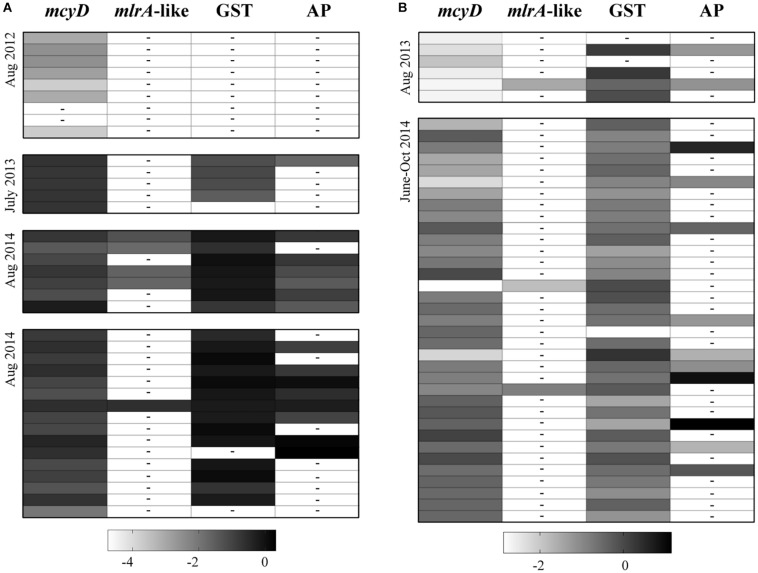
FIGURE 4.
Shadeplots representing a qualitative comparison of reads that mapped to candidate mlrA sequences (mlrA-like), GSTs and alkaline protease (AP) contigs from non-cyanobacterial prokaryotes, and mcyD from M. aeruginosa NIES843, across all samples collected from Lake Erie (A) and Lake Taihu (B). The reads that mapped to any putative genes of interest were totaled within each sample and normalized by contig length and total library size. Shading in each box represents total expression levels for each gene; the darker the color (more positive the number) the higher the expression. For visualization purposes, these numbers were log transformed. A dashed line within a box depicts a value of 0. Library sizes and values used for the shadeplot prior to transformation can be found in Supplementary Tables S3, S4. Samples in the shadeplot also appear in the same order as they do in the tables for reference.

