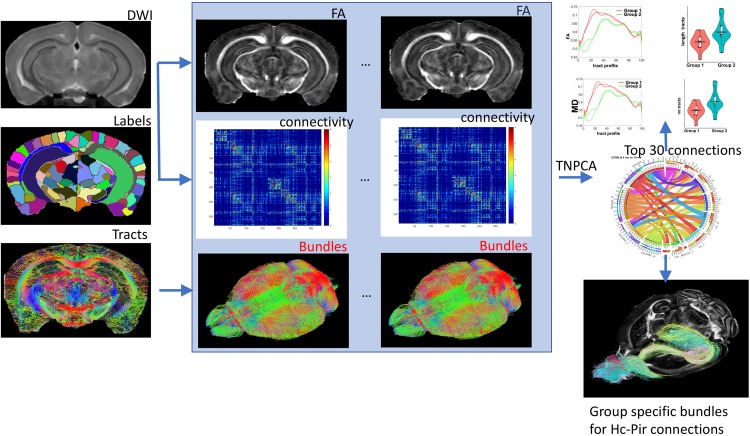
FIGURE 1.
The main elements of our flowchart for characterizing differences between mouse models based on connectivity included image reconstructions and coregistration of individual DWI acquisitions, brain parcelation in 332 regions, and connectome reconstruction based on a constant solid angle method. TNPCA was used to derive subgraphs discriminating two genotypes and the resulting selected pairwise connections between nodes were analyzed for tract length and FA differences. The hippocampus-piriform connections are shown as an example. Hc: hippocampus; Pir: piriform cortex.

