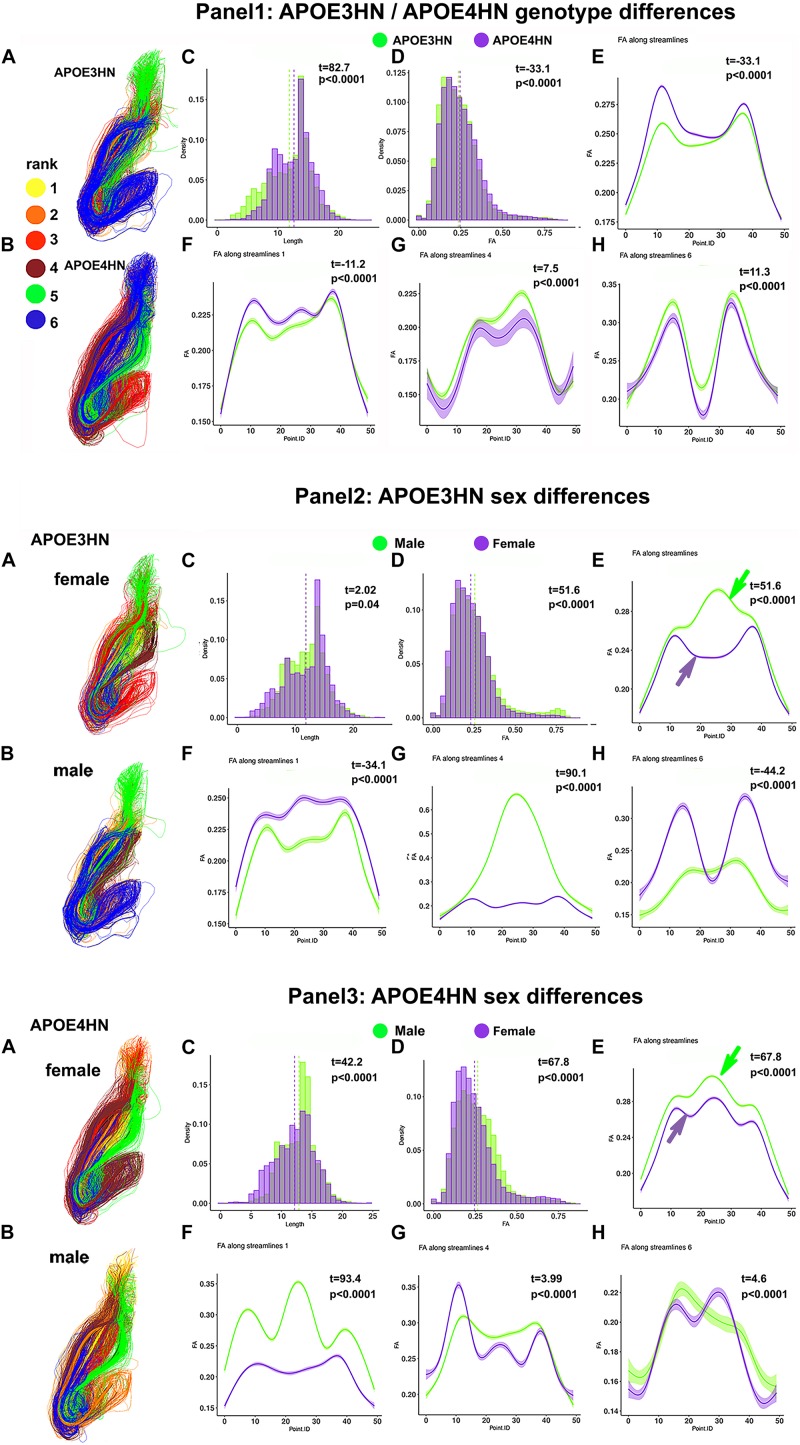
FIGURE 10.
Intrahemispheric connections between the hippocampus and piriform cortex. The first panel compares the two genotypes; the second panel compares the two sexes, within the APOE3HN genotype; the third panel compare the two sexes, within the APOE4HN genotype. Fiber length and FA distributions are shown in Panels 1–3, C, D. Qualitatively males of the two genotypes presented more similar, consistent bundle FA shapes, while females showed more variability between the genotypes (panels 2E,3E). Overall, females had lower FA along the entire bundle set in both APOE3HN (panel 2E) and APOE4HN mice (panel 3E). Interestingly, APOE3HN females had larger FA than males for the largest subbundle (panel 2F). However, FA was lower along the same subbundle in APOE4HN females relative to males of the same genotype (panel 3F), and differences were larger relative to those between males and females of APOE3HN genotype. These patterns varied by subbundle, and spatially, along the bundles.

