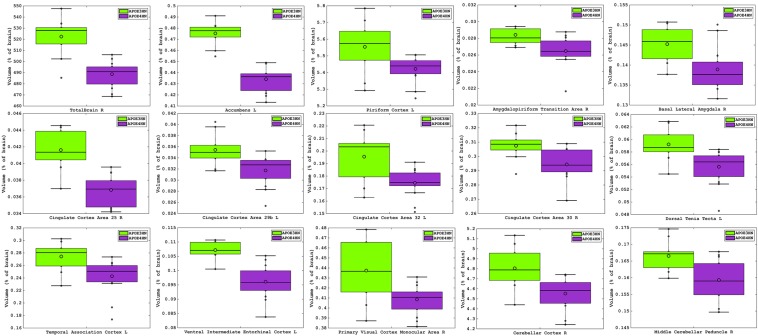
FIGURE 3.
Volume atrophy was detected in regions spanning from the rostral to the caudal aspects of the brain, and ranged from 10% for the temporal association cortex, entorhinal and cingulate cortex, down to 2% for the piriform cortex. The visual cortex, accumbens and amygdalo-piriform transition areas were ∼7% smaller and the cerebellum was ∼5% smaller in APOE4HN mice, FDR = 5%.

