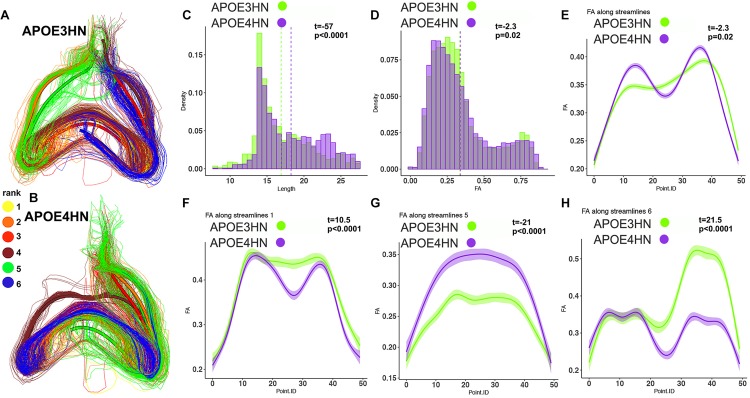
FIGURE 6.
The piriform cortex-hippocampal interhemispheric connections through the top 6 bundles were ranked according to size (yellow for the first and largest bundle, orange for the second, red for the third, brown for the fourth, green for the fifth, blue for the sixth. The interhemispheric connections appeared stronger in the APOE3HN mice relative to APOE4HN mice (A) and (B), according to the size based ranking for the major sub-bundles. This indicated different connectivity patterns for the two genotypes. Differences in fiber length distributions between the two genotypes are shown in (C), and in FA distributions in (D) using histogram densities. These indicate a slight shift toward longer length (C), but lower FA values in APOE4HN mice, which may suggest dismyelination (D). After establishing spatial correspondence through an affine bundle centroid registration, we detected that differences along the bundle containing all connections between the piriform cortex and hippocampus were not uniform (E). We identified the top 3 sub-bundles accounting for the largest difference between the genotypes (F–H). FA appeared in general lower for APE4HN mice in sections of two of these subbundles (F,H), but higher in one subbundle (G).

