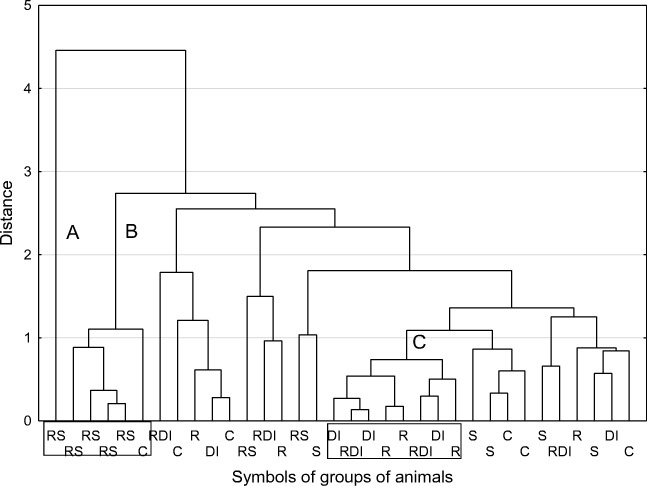
Fig. 3.
Dendrogram of similarity in immunological parameters in serum among the investigated individuals (method of grouping: average linkage procedure, function of the distance: Euclidean distance; rectangles encompass the individuals belonging to the distinguished clusters A + B and C, respectively; for details see “Discussion”)

