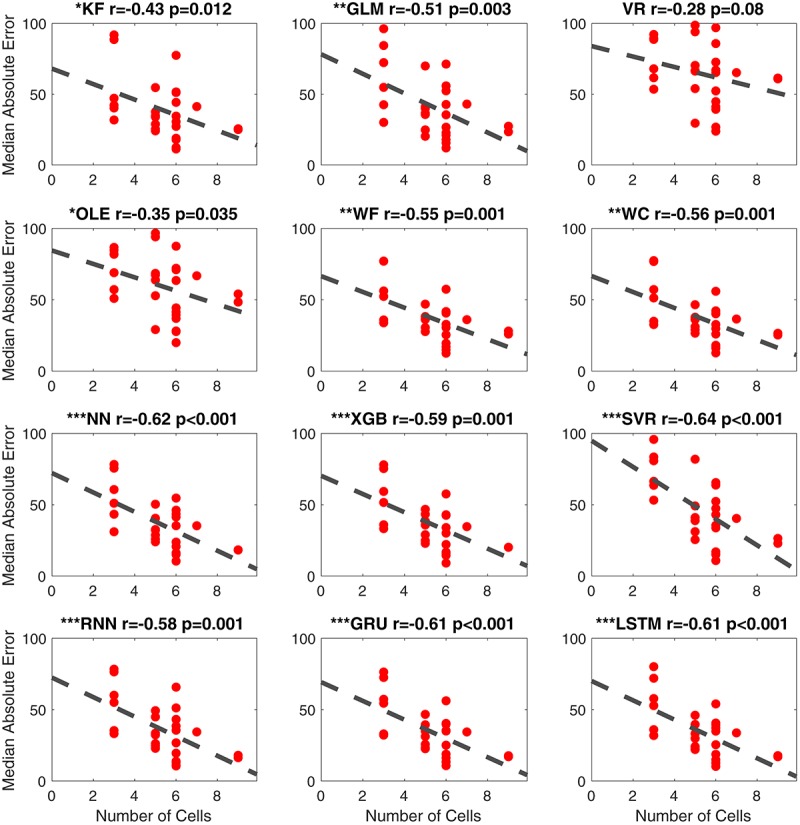
FIGURE 10.

Scatterplots of median absolute error vs. number of cells for all 12 methods. The dashed line is the fitted linear regression. The correlation coefficient (r) and the corresponding p-value are shown on the top-right corner of each panel. The significance levels are shown with symbols on the top-left corner ∗∗∗p < 0.001; ∗∗p < 0.01; ∗p < 0.05. KF, Kalman Filter; GLM, Generalized Linear Model; VR, Vector Reconstruction; OLE, Optimal Linear Estimator; WF, Wiener Filter; WC, Wiener Cascade; SVR, Support Vector Regression; XGB, XGBoost; FFNN, Feedforward Neural Network; RNN, Recurrent Neural Network; GRU, Gated Recurrent Unit; LSTM, Long Short-Term Memory.
