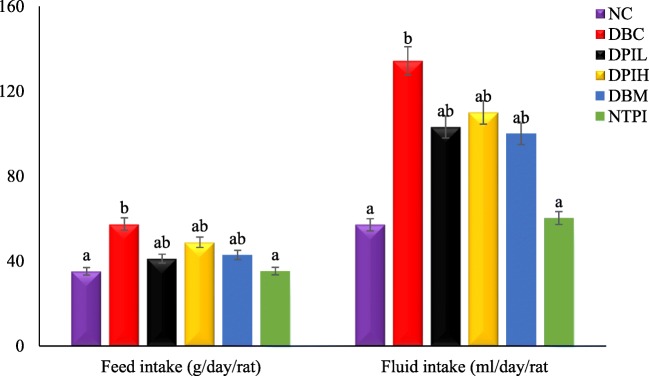
Fig. 1.
Food and fluid intake in different animal groups during the experimental period. Data are presented as the mean ± SD of 5-7 animals. a &b Different alphabets over the bars for a given animal group represent significance of difference (p < 0.05). NC, Normal Control; DBC, Diabetic Control; DPIL, Diabetic P. incana low dose; DPIH, Diabetic P. incana high dose; DBM, Diabetic Metformin; NTPI, Normal P. incana high dose

