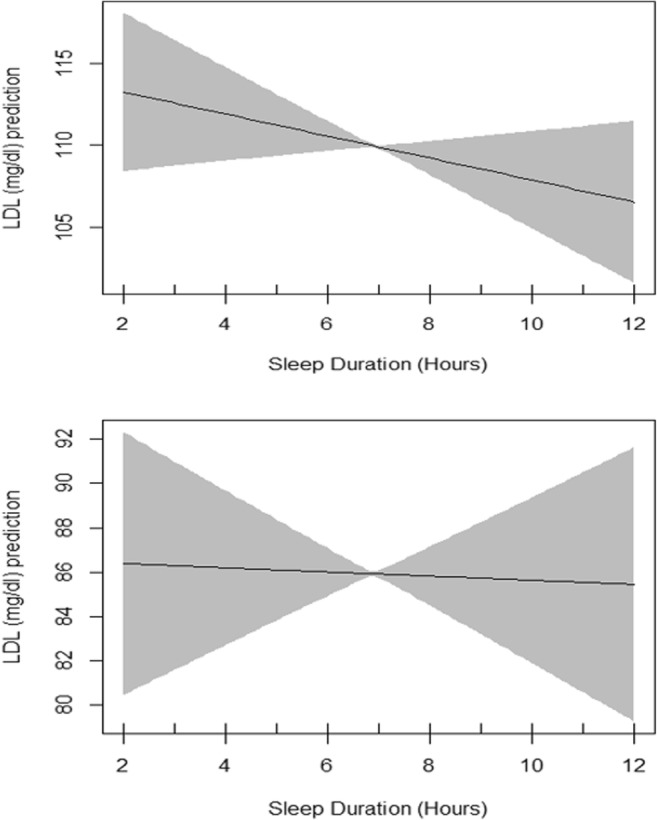
Fig. 6.

Plots of estimated smoothing spline function of sleep duration with 95% confidence band for generalized additive model when the response variable was LDL. The upper plot shows the crude smooth function of sleep duration (EDF = 1.01, p value = 0.2) whereas the lower plot represents the adjusted smooth function of sleep duration (EDF = 1.01, p value = 0.8)
