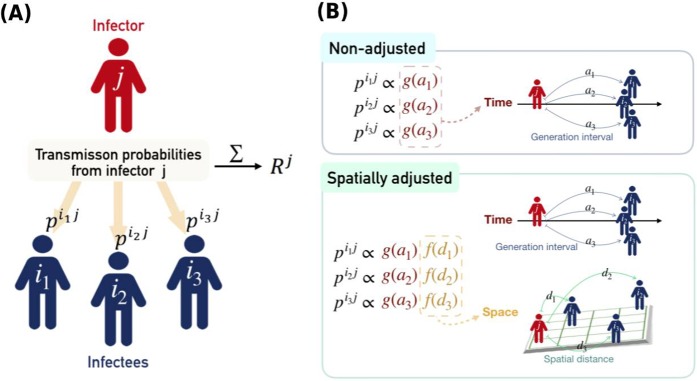
Figure 1.
Illustration of how individual reproductive numbers were calculated (panel A) and the difference between the spatially adjusted and non-adjusted methods (panel B). The transmission probability from individual j to all potential infectees is estimated first. The sum of these probabilities is, by definition, the expected number of infectees caused by individual j, i.e., the individual reproductive number. The transmission probability itself is estimated based on solely temporal relationships (non-adjusted) or in combination with spatial relationships (spatially adjusted). In the non-adjusted method, p·j is proportional to the temporal weight g(a) determined by the generation interval between infector j and its infectees. Cases in the same temporal cohort (i.e., with the same onset day, a1 = a2 = a3) share the same transmission probability from previous infectors. They also share the same individual reproductive number since their relationship to subsequent cases is again identical. For the spatially adjusted method, p·j is proportional to the spatial weights f(d), modulated by the distance between the infector and the infectees in space. Therefore, individual reproductive numbers of cases in the same cohort can be distinguished.

