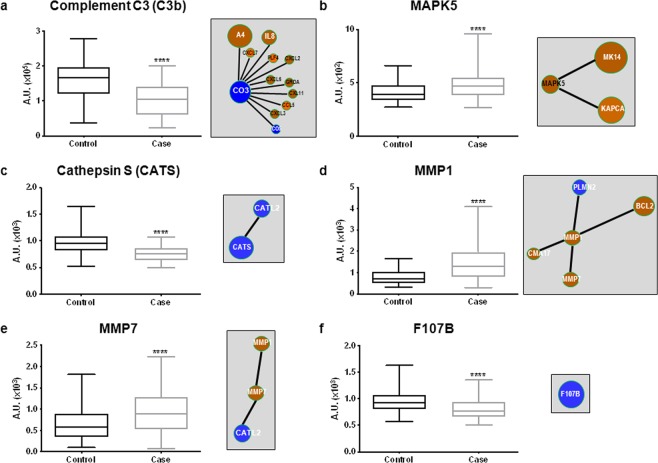
Figure 4.
Plasma levels of the 6 proteins quantified by Somalogic and linked to the molecular INCA network. Quantification of complement C3b (a), MAPK5 (b), cathepsin S (c) MMP1 (d), MMP7 (e) and F107B (f) by SOMAscan assay (left panels) and closest edges from the INCA network (right panels). Data are expressed in arbitrary units (AU) corresponding to relative fluorescence units for the SOMAscan assay. Data are presented as box-and-whisker plots showing median (line) and min to max (whisker). Statistical significance was determined by the Wilcoxon-Mann-Whitney test. ****P < 0.0001. Visualization of the INCA molecular subnetworks centralized on these molecules (right panels) for their interactions with other proteins quantified in the plasma of INCA patients. The colour of the nodes represents the log2FC of the comparison between the 2 groups of patients who died of CV causes (case) or alive (control) after 3 years, with red corresponding to high log2FC and blue to low log2FC (for details, see Supplementary Table S5). The size of the nodes is related to the centrality calculated from the INCA network model.

