
Figure 4.
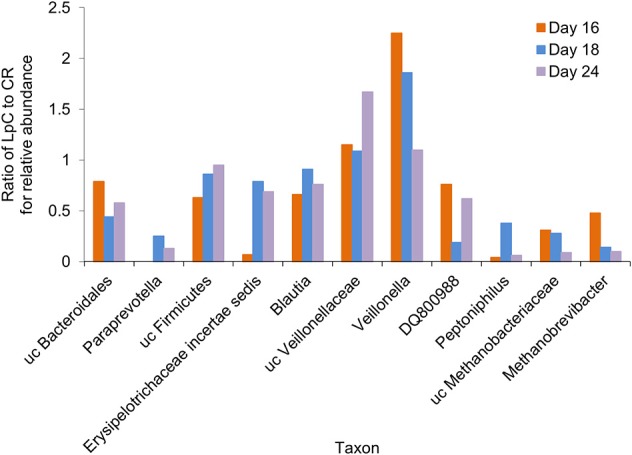
Ratio of the relative abundance of taxonomic groups between the L. paracasei (LpC)-treated reactor and the control reactor (CR) mimicking the proximal colon section (model 1) assessed with metatranscriptomics on days 16, 18, and 24. Only taxonomic groups that differed in abundance between PC_CR and PC_LpC are shown.