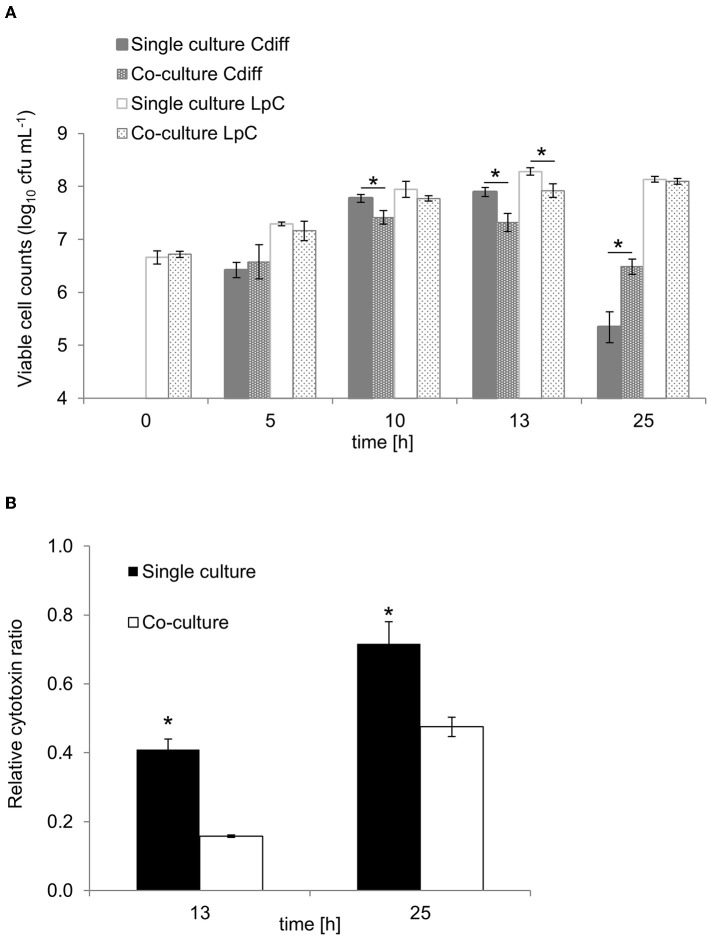
Figure 6.
Growth and cytotoxin production in co-culture study of L. paracasei (LpC) with C. difficile DSM 1296 (Cdiff). (A) Viable cell counts (log10 cfu mL−1) of C. difficile and L. paracasei in single and co-cultures. (B) Cytotoxin titers produced during single and co-cultures after 13 and 25 h of incubation calculated relative to C. difficile cell counts. Values are means ± SD of triplicate analysis of two separate experiments (n = 6). Values with an asterisk (*) correspond to growth or cytotoxin titers in single cultures that are significantly different from co-cultures.

