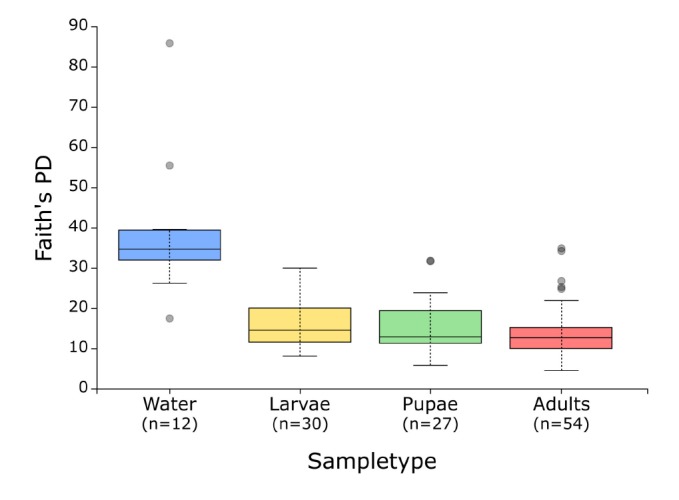
FIGURE 1.

Faith’s Phylogenetic Diversity (PD) for each sample type. Faith’s PD was calculated at a rarefaction depth of 20,194 sequences/sample. Boxes represent the interquartile range (IQR) between the first and third quartiles (25th and 75th percentiles, respectively), and the horizontal line inside the box defines the median. Whiskers represent the lowest and highest values within 1.5 times the IQR from the first and third quartiles, respectively. Circle symbols indicate outliers (values greater than 1.5 times and less than three times the IQR).
