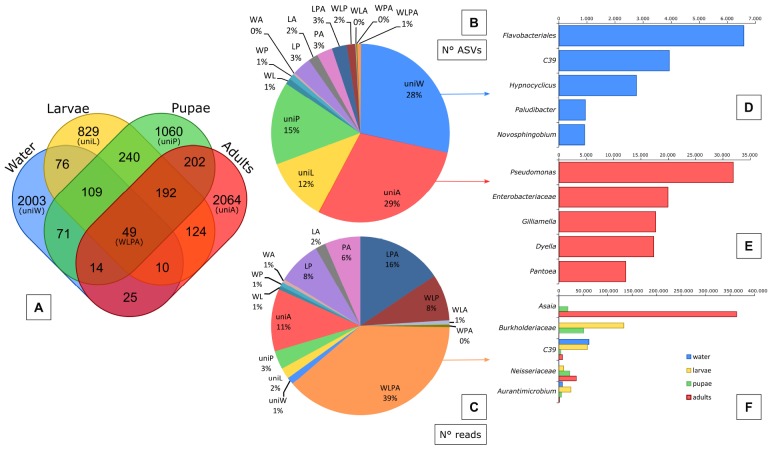
FIGURE 4.
Abundance and taxonomic composition of the microbiota shared or unique to each sample type. Venn diagram showing the number of bacterial ASVs unique to each sample type (‘uni’) or shared among each combination of sample types (W, water; L, larvae; P, pupae; A, adults) (A). Pie charts illustrating the percentage of ASVs (B) and reads (C) that were unique or shared between sample types. Taxonomic composition (5 most abundant genera) of the ASVs unique to water (D), unique to adults (E) or shared among all sample types (WLPA) (F). The identification at higher levels (family or order) is reported for unidentified genera. The venn diagrams and the charts were generated from the rarefied ASV table.

