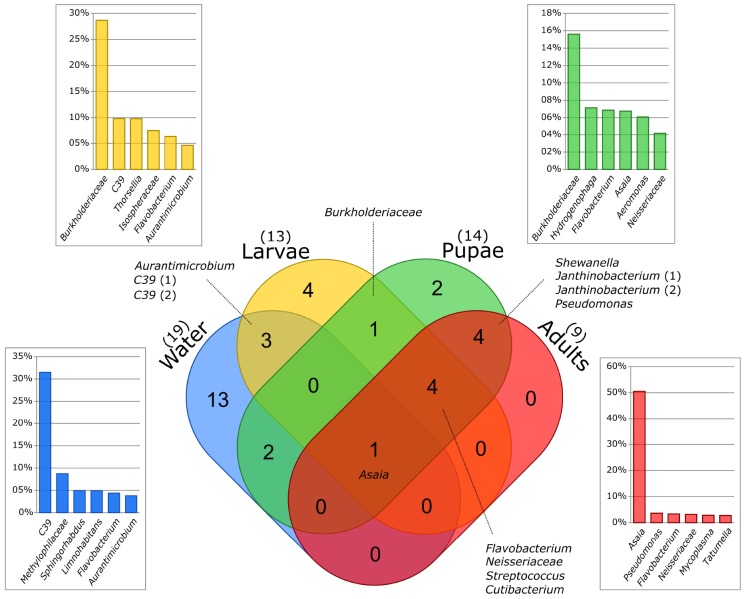
FIGURE 5.
Overlap between the core microbiome of each sample type. The core microbiome is represented by the group of ASVs with at least 10 reads in at least 50% of the samples from each sample type. The taxonomic identification of the core ASVs shared among sample types is reported. In addition, the relative frequencies of the 6 most abundant genera of the bacterial community of each sample type are reported. The identification at the family level is reported for unidentified genera.

