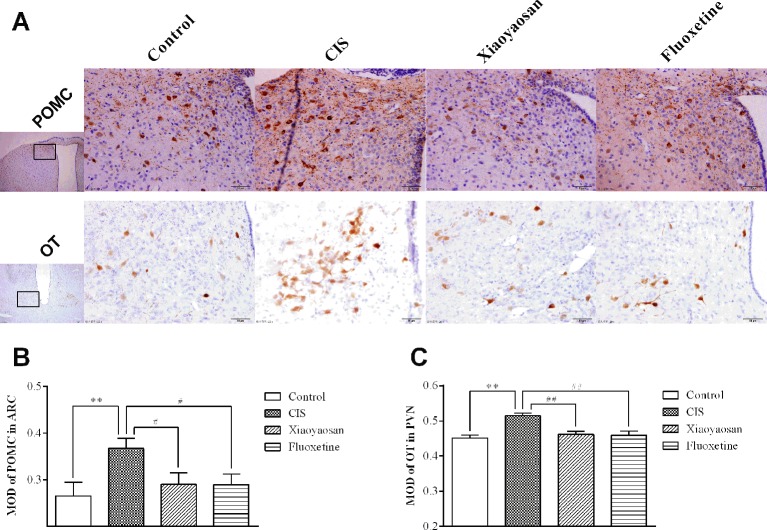
Figure 7.
Effects of Xiaoyaosan on POMC and OT immunolabeling in the hypothalamus. (A) Representative micrographs showing immunohistochemical staining for the POMC and OT proteins in the hypothalamus. Micrographs in the first row show POMC protein in the ARC, and micrographs in the second row show OT protein in the PVN. Micrographs in the first column were captured at low magnification under a light microscope (scale bar = 200 μm, 100× magnification); the remaining micrographs were captured at high magnification under a light microscope (scale bar = 50 μm, 400× magnification). (B) Quantitative analysis of POMC levels in the ARC. (C) Quantitative analysis of OT levels in the PVN. All the data are expressed as the mean ± SEM from independent experiments performed in triplicate. **P < 0.01 compared with the control group; #P < 0.05, ##P < 0.01 compared with the CIS group. N = 6 per group.

