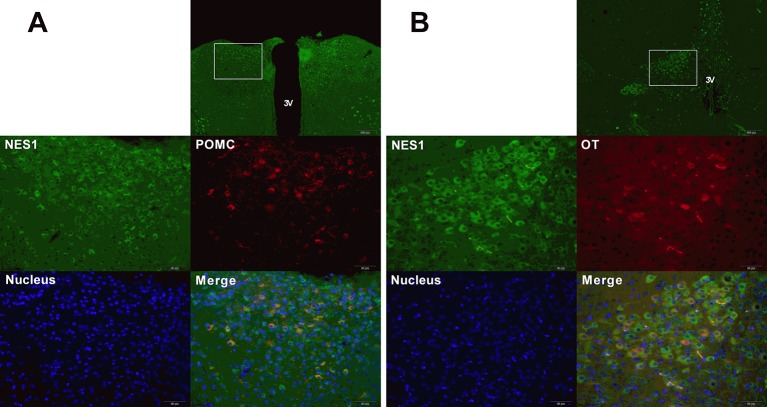
Figure 8.
Co-expression of NES1 and POMC or OT in the rat hypothalamus. Hypothalamic sections were processed for double-fluorescence labeling for NES1 (green) and POMC/OT (red), and the nuclei were stained with DAPI (blue). (A) NES1 and POMC are co-expressed in the ARC. (B) NES1 and OT are co-expressed in the PVN. Micrographs in the first row of micrographs were captured at low magnification (scale bar = 200 μm, 100× magnification); the remaining micrographs were captured at high magnification (scale bar = 50 μm, 400× magnification); 3 V, third ventricle.

