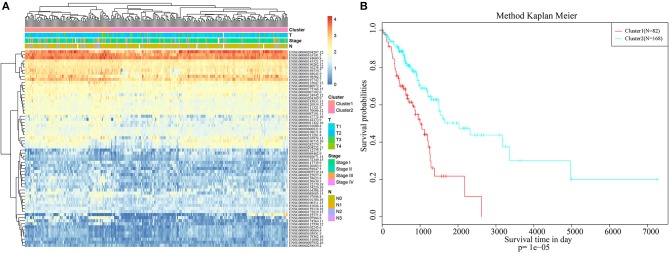
Figure 1.
Hierarchical clustering analysis of the immune-related genes. (A) The heat map corresponding to the hierarchical clustering analysis that was generated using the pheatmap function with gene expression, TNM stage, clinico-pathological stage, and histological type as the annotations. (B) The survival curves of each immune sub-types in training set. The horizontal axis represents the survival time (days), and the vertical axis represents the probability of survival.

