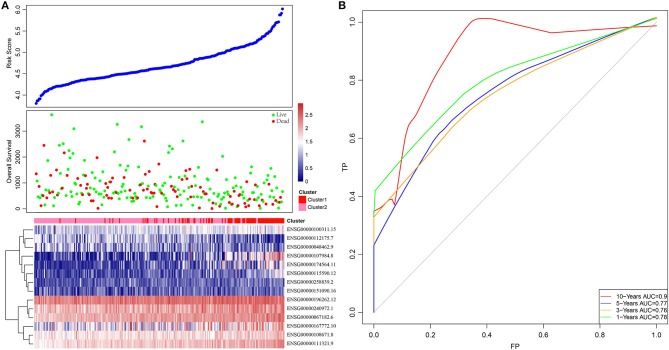
Figure 3.
The relationship between RiskScore and patient outcome. (A) Comparison of RiskScore between each immune-related gene clusters in training set. The horizontal axis represents the samples, and the vertical axis represents RiskScores, overall survival, and immune-related gene expression, respectively. (B) 1-, 3-, 5-, and 10-years ROC analysis of prognosis classification for RiskScore.

