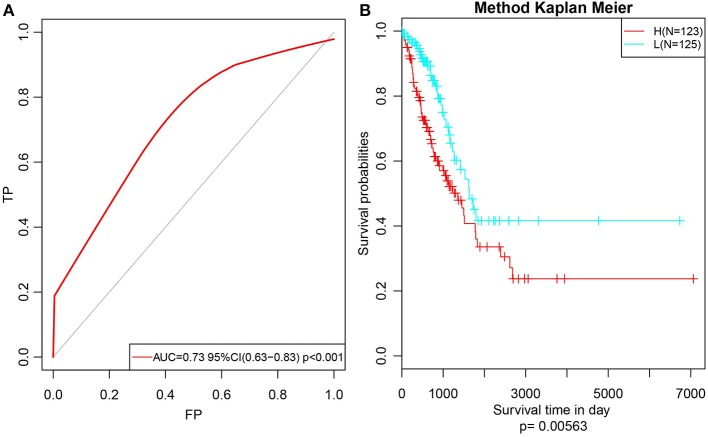
Figure 9.
Verify the stability and reliability of the prognosis prediction model for lung adenocarcinoma patients in test set. (A) The RiskScore of each sample was calculated, and the ROC curves were plotted based on the RiskScore. (B) The prognostic difference after predicted classification by RiskScore in test set.

