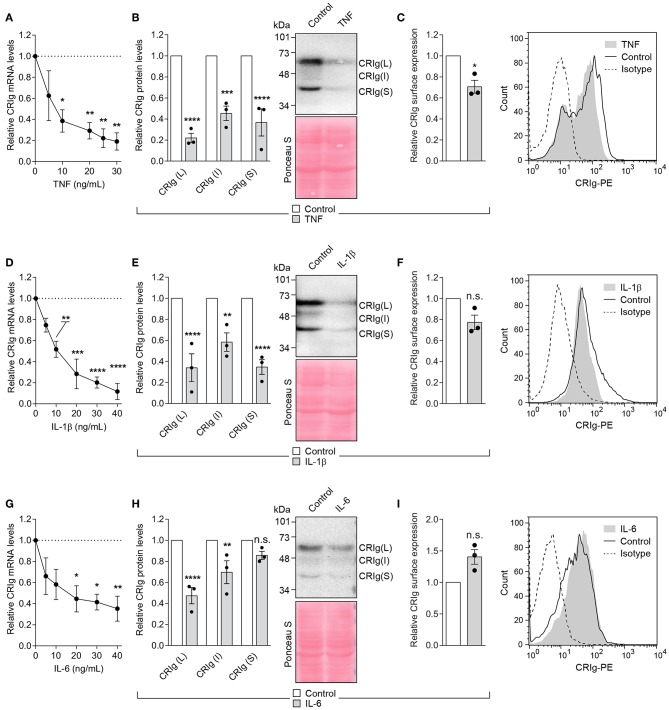
Figure 6.
Effect of TNF-α, IL-1β, and IL-10 on CRIg expression in DC. (A,D,G) DC were treated with varying concentrations of the cytokines for 24 h and then examined for CRIg mRNA expression. For examination of CRIg isoform protein expression (B,E,H) and cell surface expression (C,F,I), the cells were treated with 40 ng/ml of cytokine. Data are presented as means ± SEM of three experiments, each conducted with cells from different individuals. Significance levels are indicated by asterisks: *P < 0.05, **P < 0.01, ***P < 0.001, ****P < 0.0001, whilst n.s. indicates non-significance.

