Figure 1.
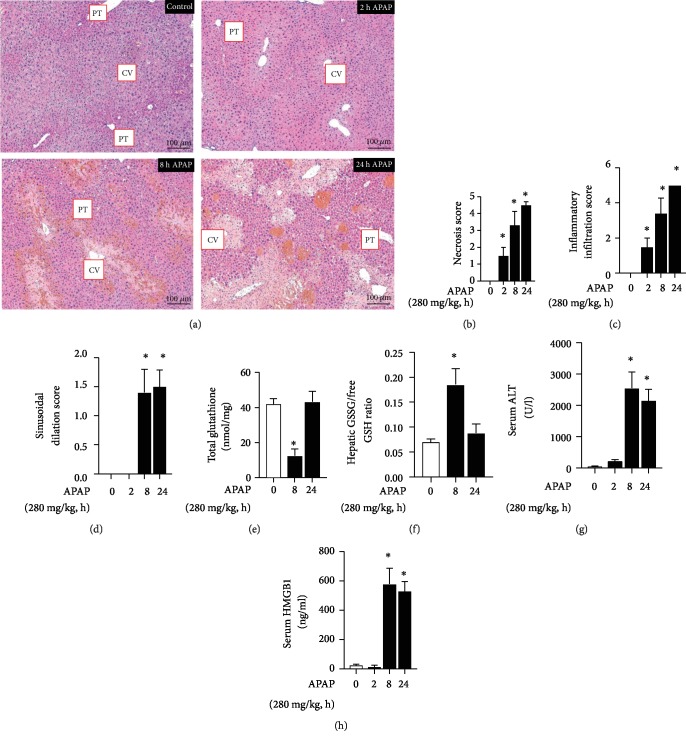
Time course of APAP-induced hepatic injury in ICR mice. (a) Representative H&E-stained hepatic sections from control and APAP-exposed (2, 8, and 24 hours; 280 mg/kg, IP) adult male ICR mice. Examples of portal triad (PT) and central vein (CV) have been added. Internal scale bar: 100 μm. (b–d) Blind histopathologic evaluation of H&E-stained hepatic sections scored for (b) necrosis, (c) inflammatory infiltration, and (d) sinusoidal dilatation. N = 6‐8 per time point. Data are expressed as mean ± SEM; ∗p < 0.05 vs. unexposed control. (e) Total hepatic glutathione, (f) ratio of oxidized (GSSG) vs. reduced free glutathione (GSH), and change in serum (g) ALT and (h) HMGB1 protein following APAP exposure (280 mg/kg, IP). N = 6‐8 per time point. Data are expressed as mean ± SEM; ∗p < 0.05 vs. unexposed control.

