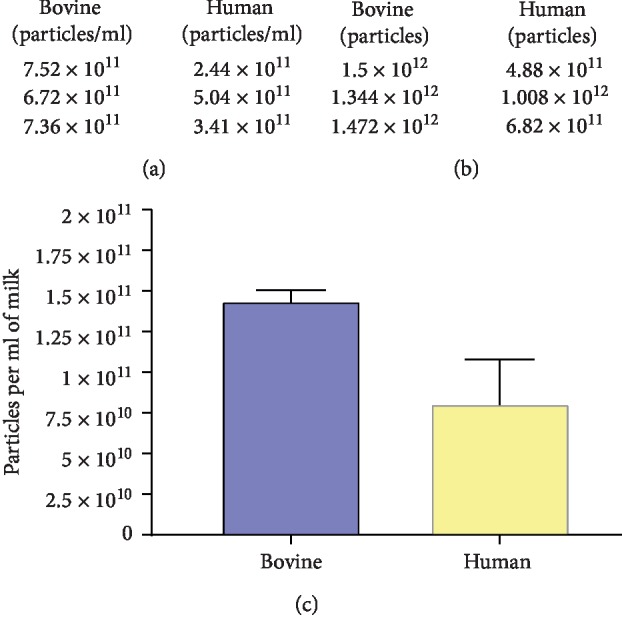
Figure 2.

Nanoparticle tracking analysis (NTA) to determine the particle concentration (particles/ml), yield (particles), and particle concentration per volume of milk of the exosomes obtained after enrichment, for pooled fractions 7–10 (n = 3 experimental replicates). (a) The table indicates concentration (particles/ml) in PBS for both human and bovine milk exosomes (n = 3 per group). (b) The table depicts the total yield (particles) obtained from both bovine and human milk in a 2 ml exosome solution in PBS (n = 3 per group). (c) The figure displays concentration of exosome particles extrapolated to the initial volume of bovine and human milk (10 ml and 9 ml, respectively). The concentration is expressed as particles per ml of milk. The Mann–Whitney U (unpaired) test revealed no significant differences between the two groups (error bars ±SEM).
