
Figure 2.
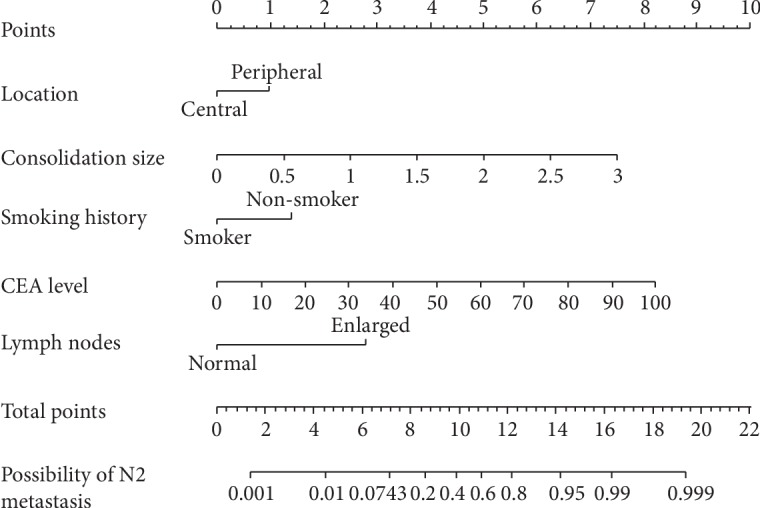
Nomogram predicting the likelihood of N2 metastasis in early lung cancers (tumor ≤ 3 cm). According to the location of value from the 2nd to the 6th axis, we can get the vertically corresponding points on the first axis. By summing up each points, we get a total point, and the vertically corresponding predicted value on the last axis shows the predicted possibility of N2 metastasis.