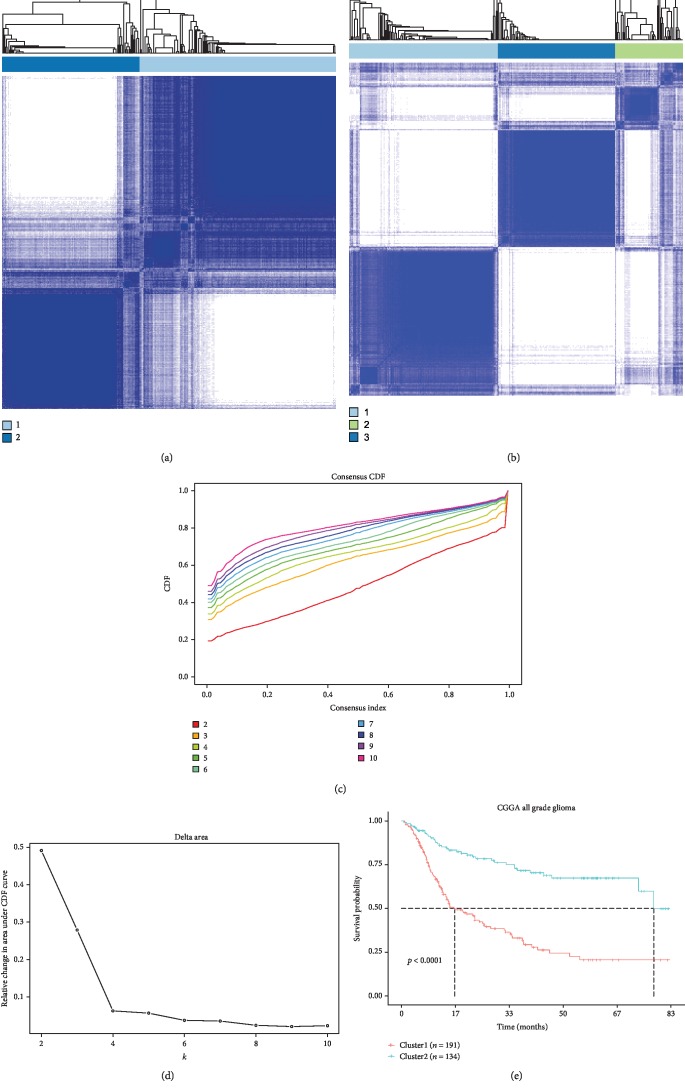
Figure 1.
Classification of gliomas based on fatty acid catabolic metabolism-related gene set in CGGA dataset. (a) and (b) Consensus clustering matrix of 325 CGGA samples for k = 2 and k = 3. (c) Consensus clustering CDF for k = 2 to k = 10. (d) Relative change in area under CDF curve for k = 2 to k = 10. (e) Kaplan-Meier survival analysis of two clusters classified by consensus clustering in the training set.

