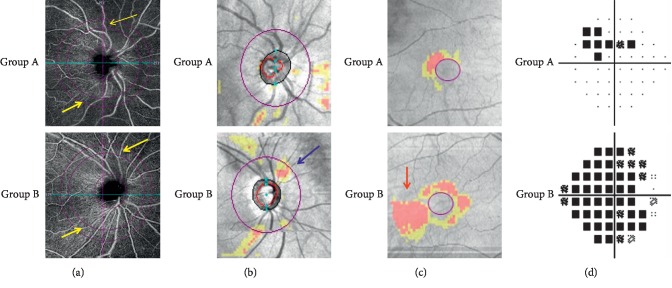
Figure 2.
Representative retinal damage images of 2 patients from different groups. (a) cpVD: OCT angiography image of a 6 × 6 mm section, centered on the optic disc head. Group A showed a better blood flow density than group B (yellow arrowheads). (b) ONH: RNFL thickness analysis examined by OCT. Group B was detected a more apparent RNFL defect in the superior region than group A (blue arrowheads). (c) GCC: ganglion cell complex thickness. An apparent GCC defect was detected in the inferotemporal area (red arrowheads). (d) MD: VF pattern deviation plot. Superior visual field loss was detected in group B patient.

