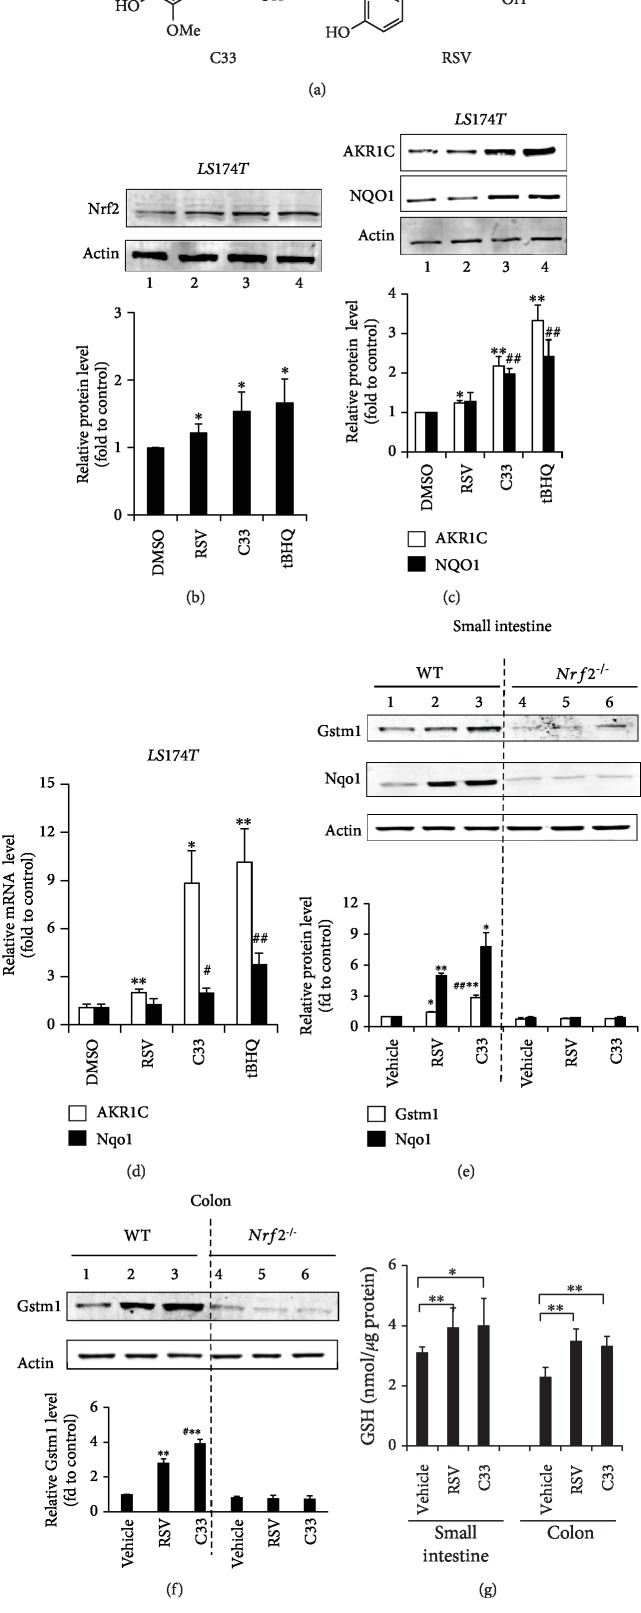
Figure 1.
C33 is more potent in activating Nrf2 target genes than RSV in vitro. (a) The structures of C33 and RSV. (b–d) C33 increased the expression of Nrf2, AKR1C, and NQO1 in LS174T cells more strongly than RSV. LS174T cells were treated with C33 (1 μM), RSV (5 μM), or tBHQ (20 μM) for 24 h. The cell lysates were analyzed by Western immunoblotting with antibodies against Nrf2 (b), AKR1C, or NQO1 (c). Actin was used as a loading control and tBHQ treatment served as a positive control. (b, c) Upper panel, representative images of Western immunoblots. Lower panel, semiquantitative result of blot. The value from cells treated with DMSO (control) was set at 1. Values are mean ± SD (n = 3). ∗p < 0.05, ∗∗p < 0.01, compared with cells treated with DMSO with same protein. #p < 0.05, ##p < 0.01, compared with cells treated with RSV with same protein. (d) The mRNA levels of AKR1C1 and NQO1were determined by Taqman RT-PCR analysis. The level of 18S rRNA was used as internal control. The value from cells treated with DMSO (control) was set at 1. Values are mean ± SEM (n = 3). ∗p < 0.05, ∗∗p < 0.01, compared with cells treated with DMSO with same mRNA. #p < 0.05, ##p < 0.01, compared with cells treated with RSV with same mRNA. (e–g) C33 is more potent than RSV in increasing the expression of ARE-driven genes in the small intestine and colon from WT but not Nrf2−/− mice. WT and Nrf2−/− mice were given C33 (200 mg/kg i.g.), RSV (200 mg/kg i.g.), or 10% ethanol (vehicle) for 3 days. Soluble extracts from the small intestine (e) and (f) colon were analyzed by Western immunoblotting with antibodies against Gstm1 or Nqo1. (e, f) Upper panel, representative images of Western immunoblots. Each lane shows the results for a sample from a single mouse. Actin was used as a loading control. Lower panel, semiquantitative result of blot. The value for the same protein from WT mice treated with vehicle (control) was set at 1. Values are mean ± SD (n = 3). ∗p < 0.05, ∗∗p < 0.01, compared with vehicle-treated mice with same protein and phenotype. #p < 0.05, ##p < 0.01, compared with RSV-treated mice with same protein and phenotype. (g) Glutathione (GSH) levels in the colon and small intestine from WT mice treated with RSV or C33. Values are mean ± SD (n = 6–9); ∗p < 0.05, ∗∗p < 0.01, compared with vehicle-treated WT mice (control). Blots in (b), (c), (e), and (f) represent results from at least three independent experiments.

