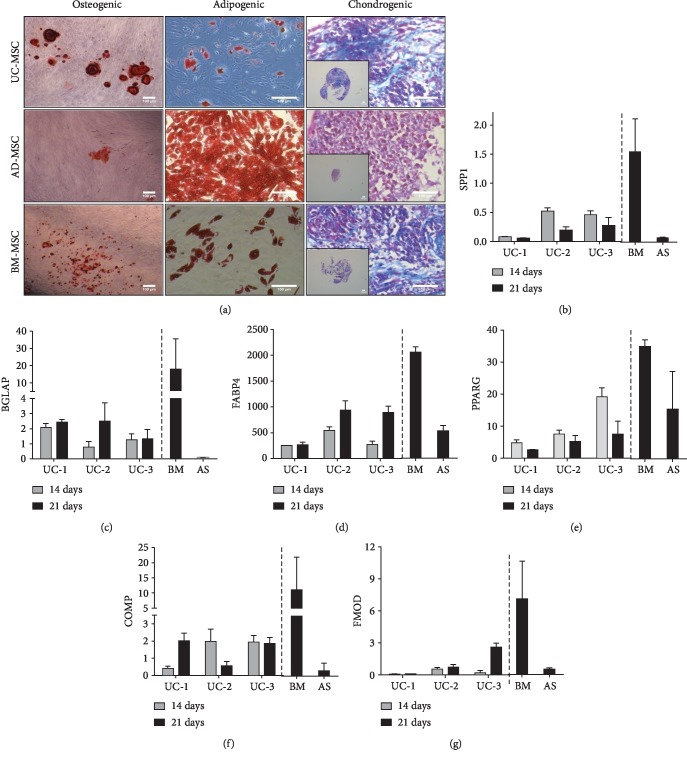
Figure 6.
Mesenchymal lineage differentiation of UC-MSC. (a) Cultured UC-MSC (passages 5-6) were induced towards osteogenic and adipogenic lineages, and differentiation was verified by Alizarin Red and Oil Red staining, respectively. For chondrogenic differentiation, UC-MSC (n = 3 donors) pellets were incubated in chondrogenic induction media and micromasses were evaluated by Masson's trichrome staining. Bone marrow- (BM-) and adipose tissue- (AD-) derived MSC were used as controls for differentiation. Embedded images show representative size of cartilage-like pellets (bar indicates 100 μm). Relative gene expression (qRT-PCR analysis) of adipocyte-, osteocyte-, and chondrocyte-related genes in UC-MSC (n = 3 donors) after 14 and 21 days of differentiation. Gene expression levels of (b) SPP1, (c) BGLAP, (d) FABP4, (e) PPARγ, (f) COMP and (g) FMOD are presented as fold increase relative to the housekeeping gene. Gene expression was also evaluated in BM and AD-derived MSC and used as controls.

