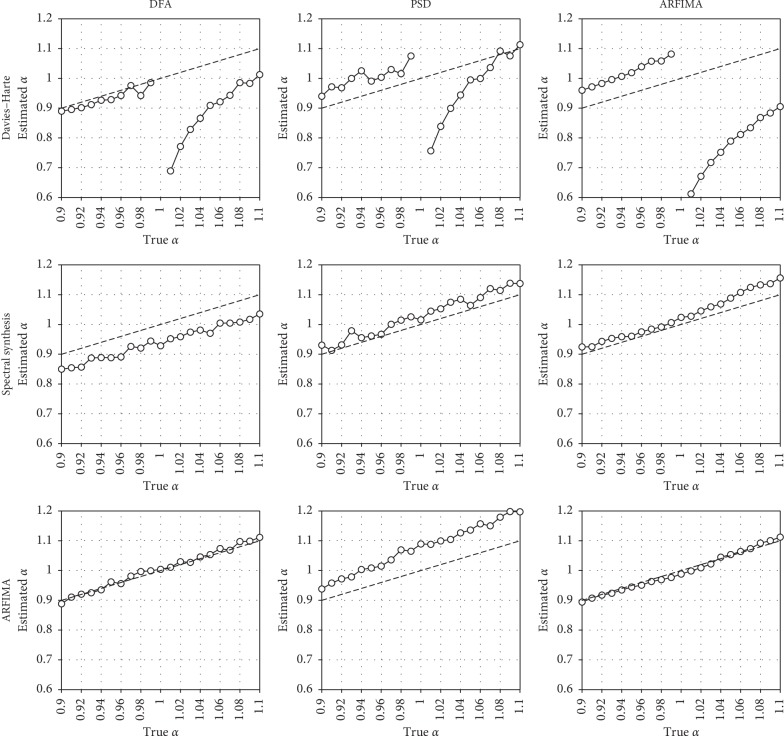
Figure 2.
Relationship between true and mean estimated α values, with a focus on the 1/f boundary (0.9 ≤ α ≥ 1.1). Top row: series generated by the DH algorithm; middle row: series generated by SSM; bottom row: series generated by ARFIMA simulation. Left column: estimations performed with DFA; center column: estimations performed with PSD; right column: estimations performed with ARFIMA modeling. Dashed lines represent identity.

