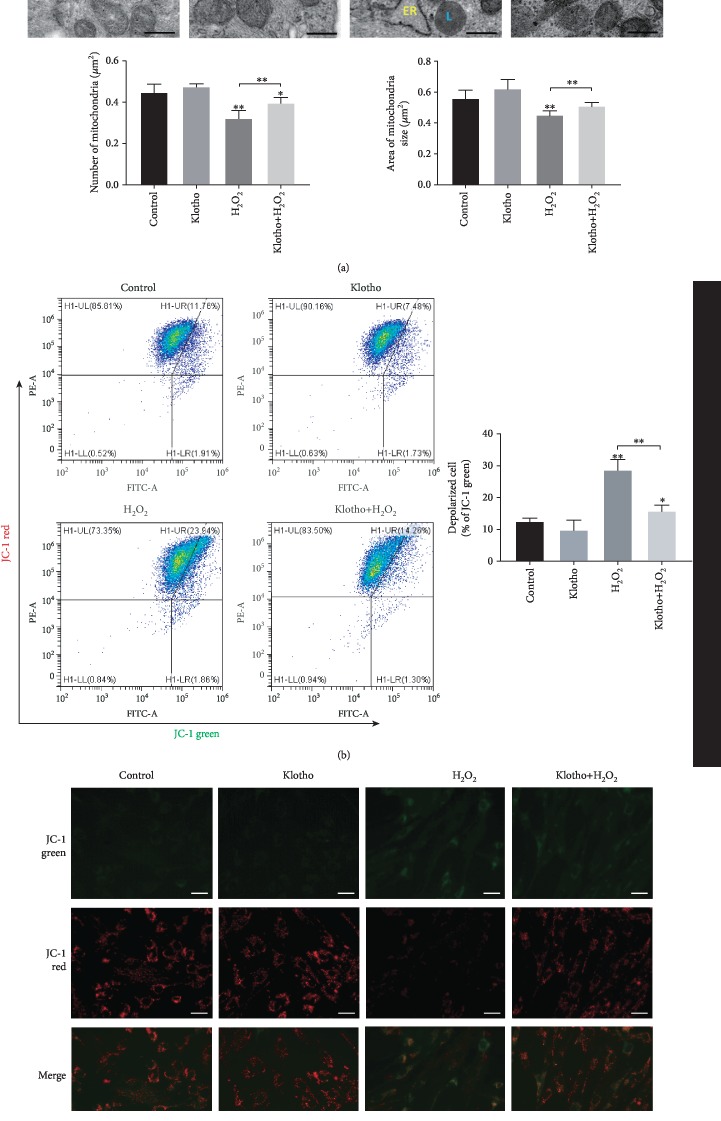
Figure 4.
Klotho administration ameliorated H2O2-induced mitochondrial destruction in hPDLSCs. (a) Representative transmission electron microscopy images of mitochondria and their quantification in each group. (b) Flow cytometry and (c) fluorescent microscopy images of the mitochondrial membrane potential in PDLSCs with different treatments. JC-1 aggregates show red fluorescence, indicating high mitochondrial membrane potential, and JC-1 monomers show green fluorescence. M: mitochondria; L: lipid droplet; ER: endoplasmic reticulum. Scale bars: 0.5 μm (a) or 30 μm (c). Magnification: 18500x (a) or 200x (c). ∗P < 0.05, ∗∗P < 0.01, and ∗∗∗P < 0.001.

