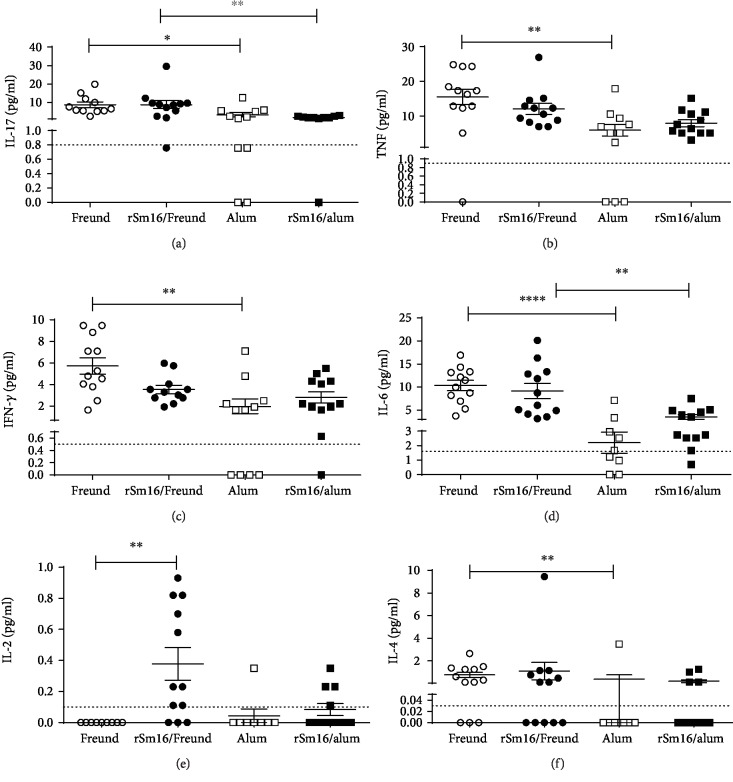
Figure 4.
Cytokine profile induced in Balb/c mice immunized with rSm16. Plasma from mice immunized with different vaccine formulations was obtained fifteen days after the third immunization for cytokine measurement. (a) IL-17, (b) TNF-α, (c) IFN-ɣ, (d) IL-6, (e) IL-2, and (f) IL-4 production in response to immunization with Freund's adjuvant only (open circles), alum only (open squares), rSm16/Freund's (black circles), or rSm16/alum (black squares). Cytokine levels were measured using the CBA Th1/Th2/Th17 kit. Mean ± SEM is presented in the graph. Significant differences observed using one-way ANOVA (d) or Kruskal-Wallis test (a–c,e, f) followed by Holm-Sidak's (d) or Dunn's (a–c,e, f) multiple comparison tests, using a correction for multiple comparison analysis, are shown in the figures. Statistically significant differences are denoted in each graph.

