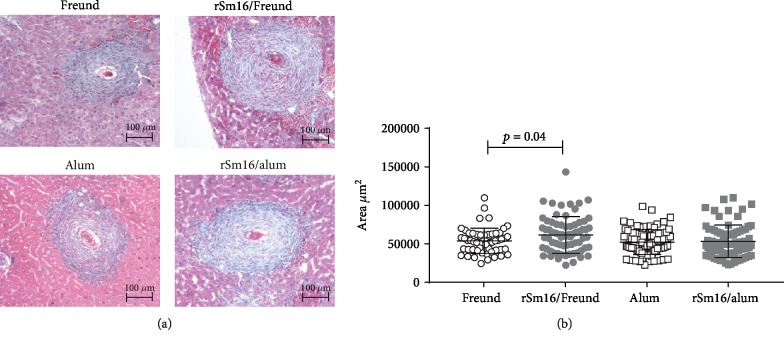
Figure 6.
Hepatic granuloma area in mice immunized with rSm16. (a) Representative histological sections of liver granulomas from each immunized group. Scale bar = 100 μm (100x). (b) Approximately 100 granulomas from rSm16/Freund's (gray circles) and its Freund's only control group (open circles) and from rSm16/alum (gray squares) and its alum-only control group (open squares) with a single well-defined egg at the exudative-productive stage were randomly selected and measured. Total area of the granulomas was expressed in square micrometers (μm2). Mean ± SD is presented in the graphs. Unpaired Student's t-test was used to analyze data from Freund's only and rSm16/Freund's groups, and the Mann-Whitney test was used to analyze data from alum-only and rSm16/alum groups. Statistically significant difference is denoted in the graph.

