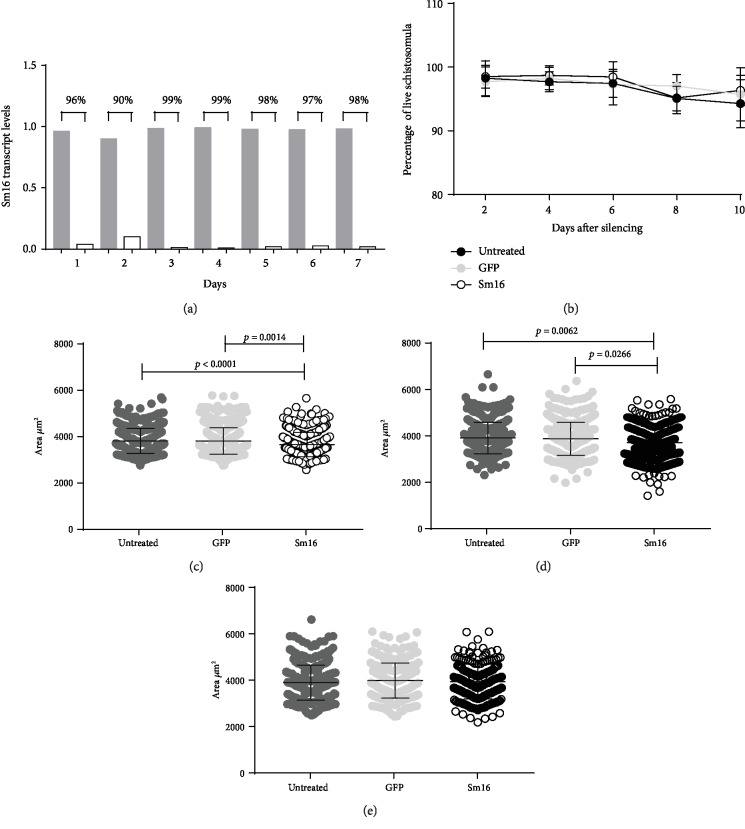
Figure 7.
In vitro analyses of parasite development following Sm16 knockdown. (a) Schistosomula were exposed to specific Sm16 dsRNA and unrelated GFP dsRNA for seven days. The level of the Sm16 transcript was assessed daily by RT-qPCR. Gray bars represent the expression of the Sm16 transcript on schistosomula exposed to GFP dsRNA and white bars to Sm16 dsRNA. The percentage numbers represent the reduction of the Sm16 transcript levels in schistosomula exposed to Sm16 dsRNA relative to those exposed to GFP dsRNA. (b) Parasite survival after Sm16 knockdown was evaluated in vitro every 2 days for 10 days. Approximately 100 schistosomula were labeled with 5 μg/μl propidium iodide and observed by fluorescence microscopy. The area of the schistosomula was evaluated two (c), four (d), and six (e) days after treatment with the dsRNA. Images of approximately 100 schistosomula were captured, and the area of each schistosomulum (μm2) was measured using AxioVision version 4.8 software. Untreated parasites are denoted by dark gray circles. Light gray circles correspond to the control GFP dsRNA-treated schistosomula and open circles to specific Sm16 dsRNA-treated schistosomula. Mean ± SD is presented in the graph. The data were generated from four independent experiments and analyzed using a two-way ANOVA followed by Tukey's multiple comparison test (b) or Kruskal-Wallis test followed by Dunn's multiple comparison test (c–e) using a correction for multiple comparison analysis. Statistically significant differences are shown in the figures.

