Figure 5.
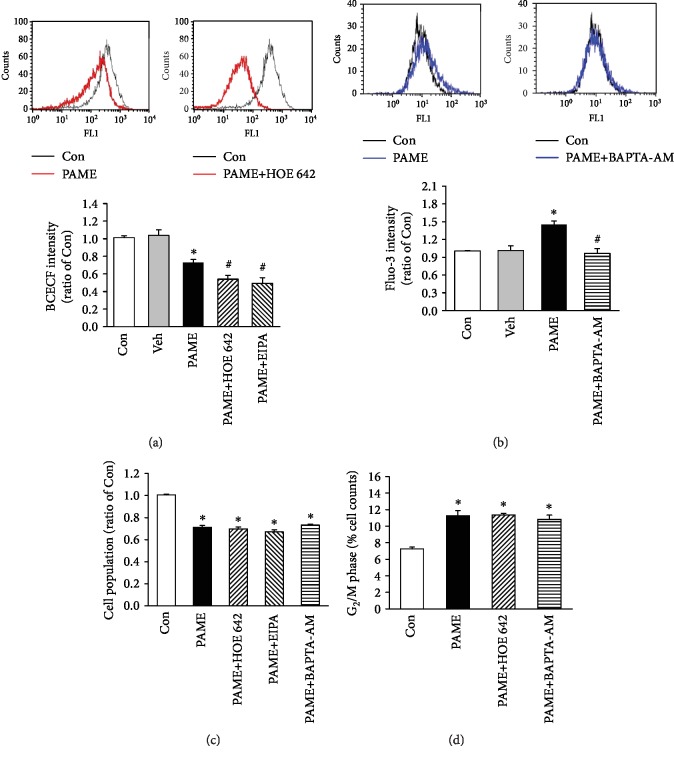
Involvement of intracellular acidosis and Ca2+ in the PAME-inhibited hBM-MSC proliferation. (a) Treatment with PAME (50 μM) for 48 h induced the intracellular acidosis, and this effect was enhanced by cotreatment with a Na+/H+ exchanger blocker, HOE 642 or EIPA. The top panel shows the BCECF intensity, an indicator of cytosolic pH, detected using flow cytometric analysis; the bottom panel shows a graph of quantitation of these data (n = 6). (b) Treatment with PAME (50 μM) for 48 h increased the intracellular Ca2+, and this effect was abolished by cotreatment with BAPTA-AM, a Ca2+ chelator. The top panel shows the Fluo-3 intensity, a fluorescence indicator of intracellular Ca2+; the bottom panel shows a graph of quantitation of these data (n = 6). (c) The PAME-decreased cell population was not significantly affected by cotreatment with HOC 642 or EIPA or BAPTA-AM. The cell population was detected by MTT assay (n = 8-20). (d) The PAME-increased cell accumulation at the G2/M phase was not significantly affected by cotreatment with HOE 642 or BAPTA-AM. The cell population at the G2/M phase was detected by flow cytometry using PI staining (n = 4). All data represent mean ± SEM. ∗p < 0.05, versus the control group; #p < 0.05, versus the PAME group. Con: control; Veh: vehicle; EIPA: ethyl isopropyl amiloride; HOE 642: cariporide; PI: propidium iodide.

