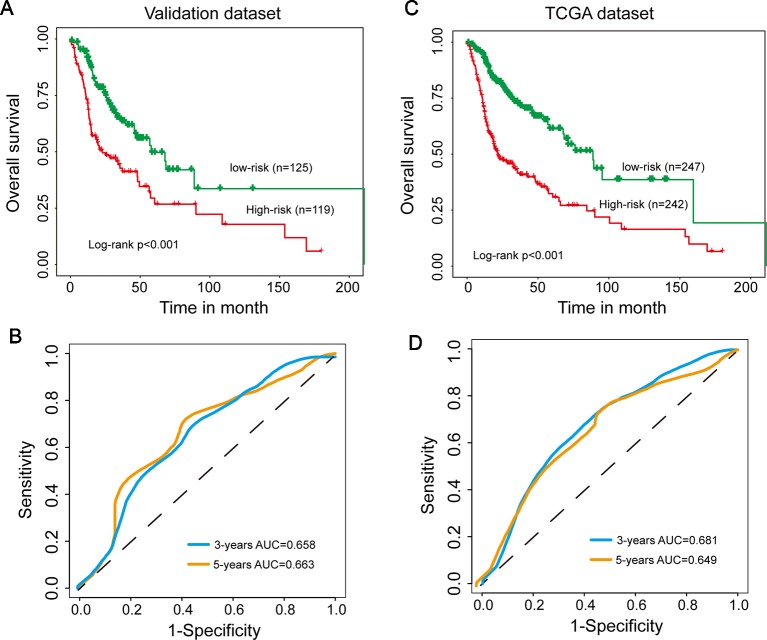
Figure 3.
Independent validation of the 15SigRS in the Cancer Genome Atlas (TCGA) data set. (A) Kaplan–Meier survival curves of overall survival between the high-risk group and low-risk group in the validation data set. (B) Time-dependent ROC analysis at 3 and 5 years in the validation data set. (C) Kaplan–Meier survival curves of overall survival between the high-risk group and low-risk group in the TCGA data set. (D) Time-dependent ROC analysis at 3 and 5 years in the TCGA data set.

