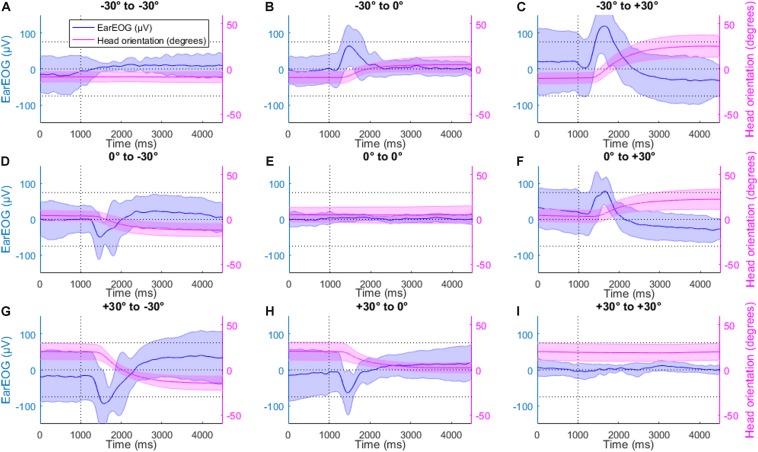
FIGURE 6.
The mean EarEOG traces for all nine possible transitions (A–I), in the head-free condition, arranged in three rows and three columns are represented in blue (left axis), with the standard deviation represented as the shaded area. The row indicates the original target position (from top to bottom: left target, middle target and right target) and the column indicates the new target after the transition (from left to right: left target, middle target, right target). In the same figures, for the same transitions and the same condition, the mean head rotation angle is also represented in magenta (right axis), with the standard deviation represented as the shaded area.

