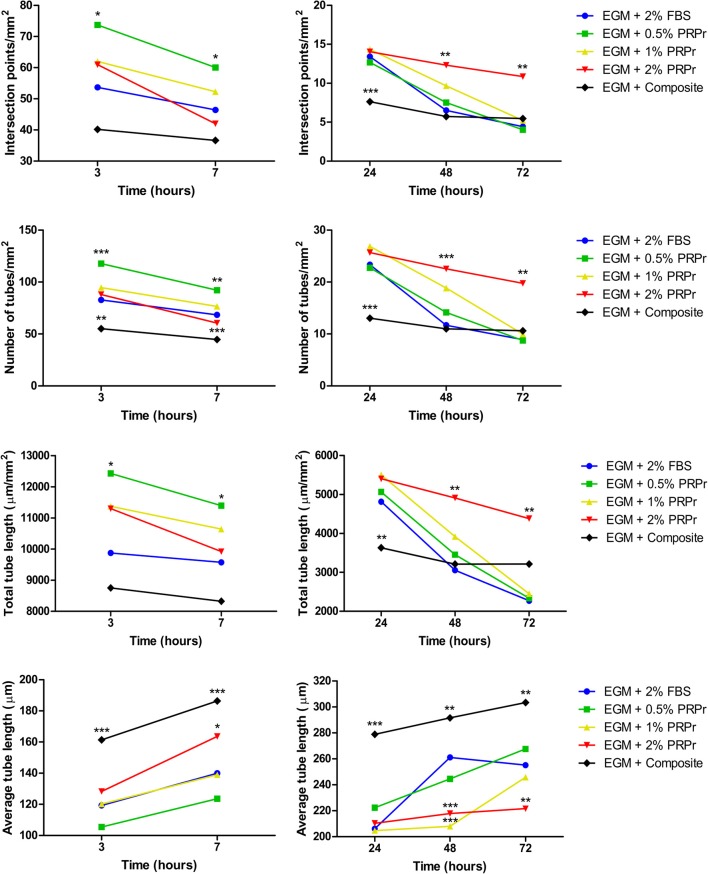
Figure 7.
Tubule formation quantification in samples with endothelial growth medium (EGM). Intersection points, number of tubes, total tube length, and average tube length were quantified. The composite scaffold matched tubulogenesis compared to 2% FBS control. Data are expressed as mean. *p < 0.05, **p < 0.01, and ***p < 0.001 after two-way Anova with Bonferroni post-test analysis compared exclusively with EGM + 2% FBS at each time-point.

