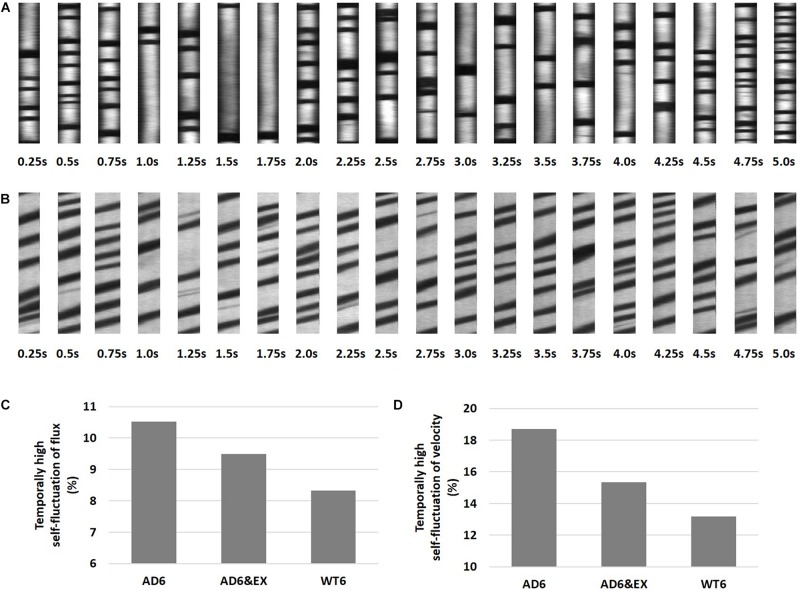
FIGURE 3.
High temporal capillary fluctuations of RBC velocity and RBC flux. (A) Representative space-time images with higher fluctuations of RBC flux as a function of time, with 0.25 s intervals during a 5-s recording window. The flux was obtained using both longitudinal and perpendicular scans, and the average value was used. (B) Longitudinal equivalent RBC velocity was calculated from the angle of dark streaks in a specific recording frame. (C) The percentage of capillaries with high temporal fluctuations of RBC velocity in all groups. The “isoutlier” method in MATLAB was applied to detect outliers with a standard deviation of RBC velocity exceeding three standard deviations from the mean. (D) Same for RBC flux.

