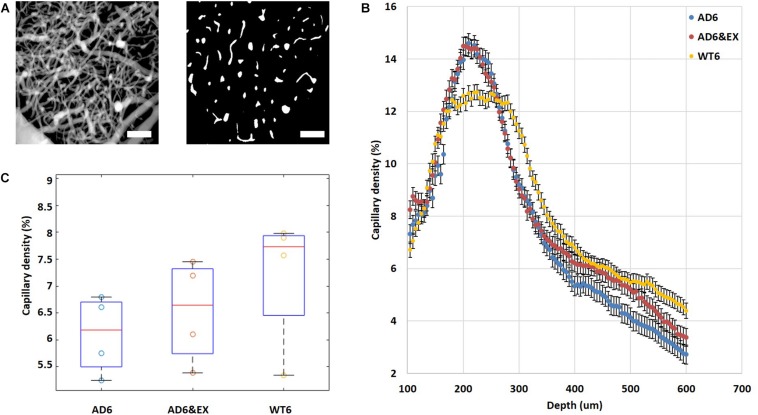
FIGURE 4.
Vascular distribution in different experimental groups and at different depths. (A) Binarization of microvascular angiograms was applied to calculate the vascular density. Left: MIP image with depths ranging from 100 to 550 μm under the brain surface with 5 μm steps. Right: an example of a binary segmentation of a single en face slice after removing the large horizontal vessels at a depth of 120 um (scale bar: 100 μm). (B) Average vascular density in different experimental groups as a function of depth from 100 to 550 μm under the brain surface. (C) Estimated vascular density (volume%). Results are presented as box plots with the median value (red line).

